JSW Steel Ltd. Technical chart | 19-Dec-2011
 Let us see the technical chart of JSW Steel, listed on Indian stock exchange, using ichimoku kinko hyo indicator.
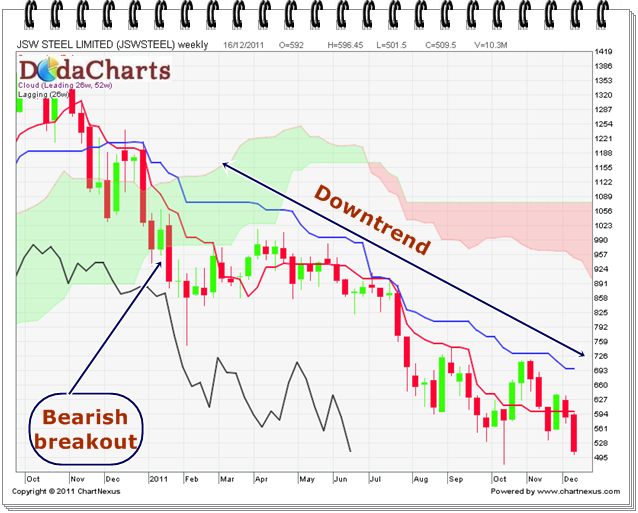
The stock price clearly indicated bearish breakout on 28-Jan-2011, when it closed below kumo @880.60. That was a strong sell signal as that happens on weekly chart itself. After that, it started its downward journey and in the last session, it closed at 509.50. The price is still trading below kumo, below kijun-sen line and Chikou-Span (CS) line is still below kumo. Not even a single sign of positive in this stock.
I don’t know, then why "so-called" experts are recommending to buy this stock at these levels.
One can buy this stock when it closes above kijun-sen level viz. at 696.70 and not before that.