Jyothy Labs Technical chart | 06-Dec-2011
Let us discuss the technical chart of Jyothy Labs, listed on Indian stock exchnage, with ichimoku indicator.
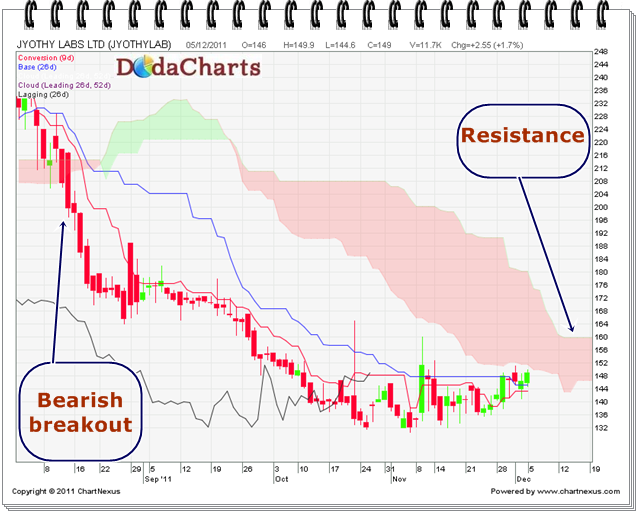
The stock price closed below kump on 207.50 on 11-Aug-2011; thus giving bearish breakout. As a result, we witnessed sharp downfall of the stock price. Still, the price is trading below kumo. So, do NOT buy this stock even after so much correction.
The resistance is in the range of kumo viz. at 146.80 to 160. So, buy it ONLY when it closed above 160.