Keltner Channel Tutorial
Experts call the "Keltner channel" among the simplest and most effective Forex tools. This channel got its name from the name of its creator. The principle of operation of this trading tool is based on the same principles as Bollinger bands or moving average envelopes. However, it also has significant differences.
Description of the Keltner Channel indicator
The Keltner Channel is a trend indicator that was developed in 1960 by Charles Keltner and later described in his book How to Make Money Trading Commodities.
According to the calculation scheme, the operation of the channel is similar to the operation of the Bollinger Bands indicator. However, in this case, the standard deviation is not used as the basis, but the average true range (referred to as ATR).
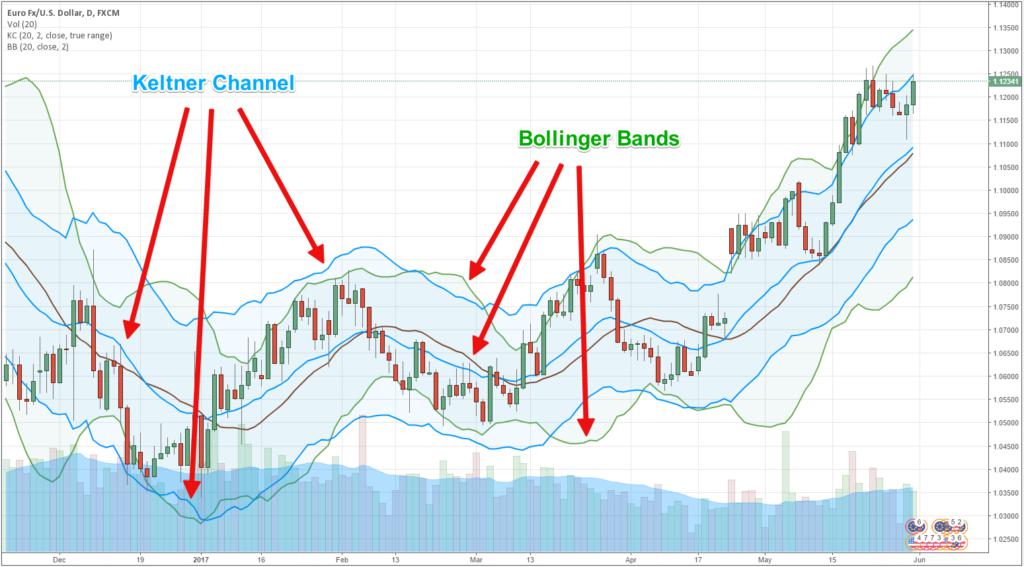
Keltner Channel indicator on Chart
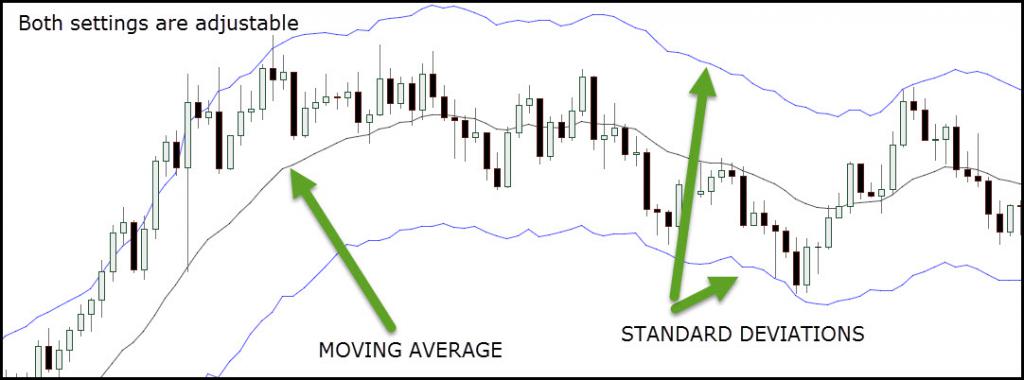
Keltner Channel on the chart is represented by three lines, which are located in close proximity to the price level. The role of the main performs the central line, which is called the moving average. The other two are located above and below the average and represent lines with a certain deviation specified in the settings.
This indicator is one of the standard ones, so it is present on many trading platforms. If the tool is not available, it can be found in the public domain and downloaded. After that, the folder with the trend indicator is moved to the trading terminal.
Setup of Keltner Channel in MetaTrader
To build and calculate the Keltner channel in MT4, you will need the following values:
EMA (moving average) - by default, the period is set to 20 days;
upper line - it is calculated by the formula EMA + ATR?2;
the bottom line is calculated in a similar way: EMA - ATR?2.
At the same time, a period of 10 is often set in the ATR settings.
You can use this tool on different currency pairs and on all timeframes. To reduce the number of false signals, you may need to adjust the settings depending on the selected timeframe.
To choose the right period, you should pay attention to the trading strategy. The default settings are suitable for an intraday chart. However, you should not use a timeframe less than one hour.
Traders who open long-term positions should set a period greater than the specified one.
Interpreting Signals given by Keltner Channel
The peculiarity of this trading instrument is that it belongs to trend indicators. With its help, an experienced trader will only need a couple of minutes to assess the overall situation on the market.
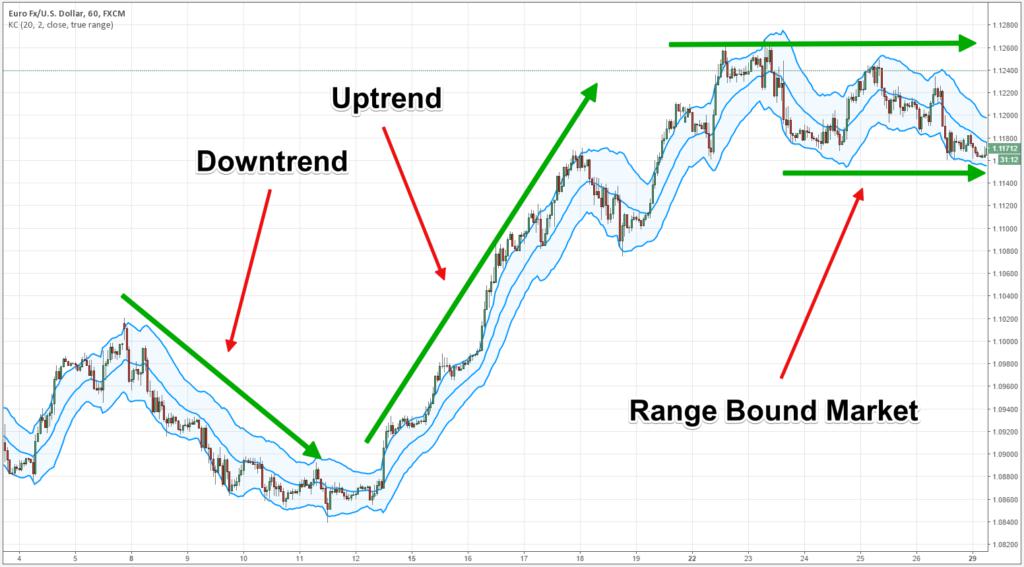
- An upward channel indicates a rising price.
- The falling Keltner Channel corridor indicates a downward price trend.
- Lateral movement in a narrow corridor indicates a temporary absence of a trend. In such cases, the price fluctuates slightly between the upper and lower channel lines.
This data can be used as the basis for several strategies. Each of them has its own requirements for opening and closing orders. However, there are several common signals.
- The breaking of the upper line of the channel indicates a sharp increase in the strength of the market.
- When the lower border is broken, we can talk about the weakening of the asset.
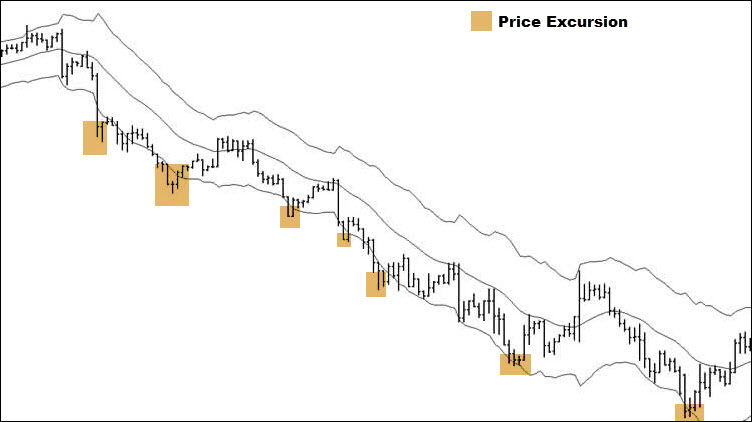
- The situation in which candles or bars are located outside the channel is a signal that the trend will soon change its direction.
At the same time, it should be remembered: in addition to true signals, numerous false signals will appear on the chart. To minimize risks, you should not choose a short timeframe. In addition, experienced traders are advised to wait for signal confirmation.
Finding Support and Resistance with Keltner Channel
The upper and lower borders of the corridor act as support and resistance lines. In other words, when moving, the price periodically rebounds from the lower line and moves to the upper one, and vice versa. This characteristic is successfully used by many traders. When rebounding from the upper border of the corridor, a sell order is opened. When rebounding from the bottom line, a purchase is made.
This strategy for the Keltner channel allows you to trade on any currency pair and on any timeframe. At the same time, both a pronounced trend movement and a flat state are suitable for trading.
This trading option is more suitable for intraday charts. When using it, there is some risk if the order is opened against the trend.
Breakout strategy with Keltner Channel
Keltner himself believed that the penetration of the corridor is a sure sign of the emergence of a strong trend. It is for this reason that the intersection of the support and resistance lines requires special attention.
It is important to take into account the direction of trade. The order is opened in the direction of penetration.
- If a candle or a bar has broken through the upper boundary of the corridor, then you should open a buy deal.
- Closing a candle or a bar outside the lower boundary of the corridor is a sell signal.
It should be noted that trend trading is less risky and therefore suitable for conservative traders. The difficulty lies in the fact that it is not easy to identify the emergence of a new trend. This is due to the appearance of false signals. To eliminate interference, some traders advise using additional technical analysis tools.
Flat trading with Keltner Channel
In the financial market, it is not always possible to detect a strong price movement in a certain direction (up or down). Quite often, a flat can be observed on the chart.
The term “flat” is commonly understood as a situation in which the movement of the market price occurs horizontally. A characteristic feature can be called a slight price fluctuation. Under such circumstances, the Keltner channel becomes narrow, and the price periodically bounces from its borders. At the same time, the price difference between the high and low remains small.
For many traders, the flat situation in the market is a signal for successful trading. The profit from each transaction is small, but the number of orders can compensate for minor fluctuations.
Difference between Bollinger Bands and Keltner Channel
There are three differences between the Keltner Channel and Bollinger Bands.
First, the Keltner channel is smoother than the Bollinger bands. This is because Bollinger Bands are based on standard deviation, which is less robust than ATR.
Second, the Keltner Channel is calculated using an exponential moving average, which is more sensitive than the simple moving average used in Bollinger Bands.
Thirdly, the Keltner channel is better suited for trading stocks, while the Bollinger bands are better for trading options. This is because the boundaries of the Keltner channel are at a constant distance from the moving average and provide more reliable price targets.
While Bollinger Bands depend on market volatility. When the Bollinger Bands are narrowing, it means that the volatility in the market is low and it is possible to buy options. When the bands become wider, the volatility in the market increases and options should be sold.
It is important to remember that neither the Keltner Channel nor the Bollinger Bands should be considered as a separate trading system. Both indicators should be used in combination with other indicators.
Benefits of using Keltner Channel
The frequency of using this trading tool is explained by several advantages of the indicator.
- Versatility. You can apply this indicator on all types of timeframes and for any currency pair. To do this, you will only need to correct the data in the settings.
- Ease of use. The Keltner channel indicator for MT4 is suitable for experienced traders and for beginners. This is explained by the absence of complex constructions: it is enough to indicate the initial data for the calculation.
- No extra noise on the chart. Compared to some other technical analysis tools, Keltner Channel not only provides information about the direction of the trend, but also allows you to get clear signals about the start of trading.
Disadvantages of Keltner Channel
Like any other indicator for trading in the financial market, this tool has several drawbacks.
Lack of universal settings . The need to make adjustments to the calculations can be called a kind of disadvantage. The fact is that for each timeframe, data should be carefully selected. Otherwise, trade will be ineffective.
So, Keltner Channel is an indicator for trading in the financial market, which has earned wide popularity due to its convenience and ease of settings, the ability to use it on a chart with absolutely any source data. Forex experts note its high efficiency. However, to achieve such indicators, experience in tracking signals and developing a strategy using additional tools will be required. In addition, it is worth entering data on the Keltner channel into the Expert Advisor, which greatly optimizes the process.