Kirloskar Bros Invest Ltd. (KBIL) Technical Chart | 23-Dec-2011
Below is the technical chart of Kirloskar Bros Invest Ltd., using ichimoku Kinko Hyo indicator.
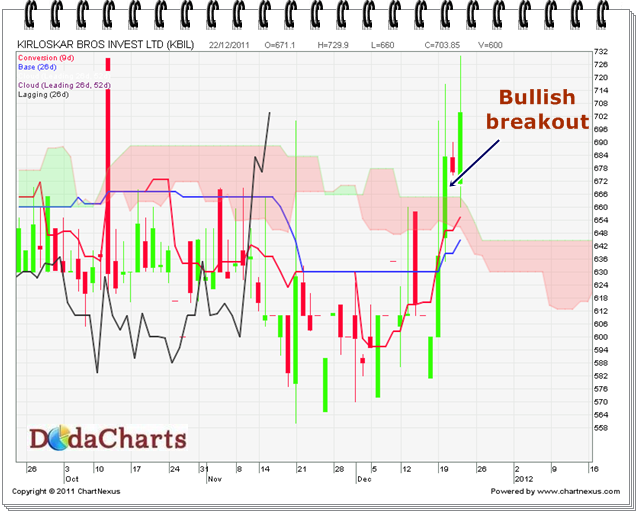
Yesterday, this stock price closed above kumo @703.85. Chikou-Span (CS) line also closed above kumo. So, it clearly gave bullish breakout signal. One can buy this stock now with the stop loss of 644 for the target of 801 in near term.