Kumo Breakout in Silver Chart – Technical Analysis
Today when I saw the technical chart of Silver, only one word comes to my mind – Kumo Breakout.
Let's find out what's that & why silver is trading at all time high.
I am using snapshot of Silver chart from MetaTrader software using Ichimoku indicator.
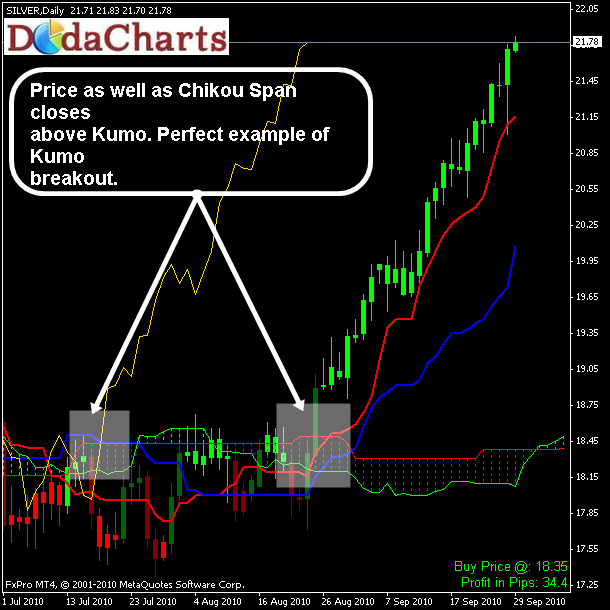
Around 26th Aug 2010, Silver price closes above Kumo and at the same time Chikou span (CS) also closes above kumo.
When both CS & price closes above kumo, just buy that without any doubt. That's a signal that price will surely move upwards now. Just keep the Span A and Span B lines as your stop-loss in the beginning & then later on Kijun-Sen figure as your trailing stop-loss. You can use ParaBolic SAR value also as a trailing stop-loss. Whatever you're comfortable with, but don't trade without stop-loss & then trailing stop-loss.
Coming back to Silver chart, one should place trailing stop-loss of Kijun-sen in it while trading.
Hope you like this article. if you've any doubts on it, please discuss the same in comments section below.