Line Break Charts
Introduction to Line Break Charts
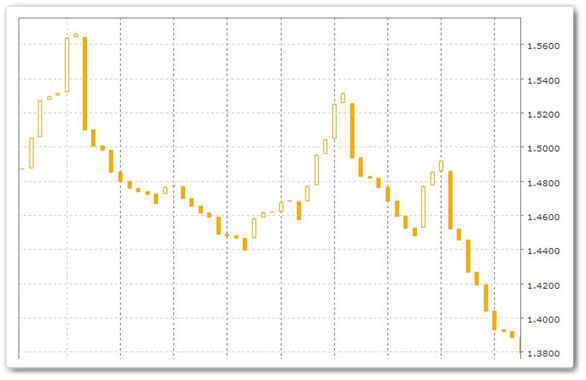
The linear breakout graph is a set of vertical rectangles (called “lines”), which are built on the basis of closing prices. In this method, the time axis and transaction volume data are not used (similarly with the tic-tac-toe charts, Kagi and Renko). As Steve Neeson says in his book “Beyond the Limits of Japanese Candles”: “The linear breakout graph is a more perceptive form of Xeroxes when the turns are determined by the market, rather than arbitrarily defined rules.” The linear breakout graph looks like this:
Drawing a linear breakout graph
The construction of the chart begins with the determination of the base price and the comparison of the base price with the closing prices of the subsequent bars.
The first line (baseline)
- A white line is drawn if the closing price of the current bar is greater than the base price;
- A black line is drawn if the closing price of the current bar is less than the base price.
The second line
Draw the next line (in the next column) WHITE, if its maximum is higher than the high of the previous WHITE line;
OR
Draw the next line (in the next column) BLACK if its minimum is below the low of the previous BLACK line.
The third line
Draw the third line (in the next column) WHITE, if its maximum is higher than the highs of the two previous WHITE lines;
OR
Draw the third line (in the next column) BLACK if its minimum is below the minimums of the two previous BLACK LINES;
OR
Do not draw anything on the chart if the new price is within the range of the two previous lines.
The subsequent lines are drawn according to the conditions for the third line until a linear breakthrough occurs. Also, note that the prices of new bars should EXCEED a maximum or a minimum of the previous lines.
A linear breakthrough
If three successive BLACK or WHITE lines are formed on the linear breakout graph, this confirms a bearish (BLACK) or bullish (WHITE) trend. In this case, the reversal will take place only if the price of the current bar is below the low of the previous three lines (in the case of a reversal of the HIGH trend) , or the price will be higher than the maximum of the three previous lines (in case of a reversal of the BEAR trend) .
Case A. Three consecutive white lines
Draw the WHITE line (in the next column) if today’s maximum is higher than the maximum of the THREE WHITE LINES;
OR
(ROTARY LINE) Draw a BLACK LINE (in the next column) if the current minimum is below the minimum of THREE WHITE LINES.
Case B. Three consecutive black lines
Draw the BLACK line (in the next column) if the current minimum is below the minimum of THREE BLACK LINES;
OR
(ROTARY LINE) Draw the WHITE LINE (in the next column) if today’s maximum is higher than the maximum of the THREE BLACK LINES.
A new line (BLACK or WHITE) is added to the next column if the current maximum is higher than the high of the previous WHITE line or if the current minimum is lower than the low of the previous BLACK line.
If there are three consecutive BLACK or WHITE LINES on the chart, the DOT LINE is drawn only if the current maximum is higher than the highs of the three previous white lines, or if the current minimum is below the lows of the three previous black lines.
We apparently that the turn occurs when the price should “break” a maximum or a minimum of the three previous lines. Such graphs are called three-line breakout graphs. The linear breakout graph can be constructed not only for three lines but for any number of them, for example, for 2 or 18 lines. But the most common are three-line graphs.
Trading on the graphs of a linear breakout
The linear breakout graph shows the changes in the main trend in the market. Confirmation of a trend change is generated when a reversal line is formed. In this way:
Buy when the white line appears after three consecutive black lines;
Sell when the black line appears after three consecutive white lines;
Avoid trading in markets with no trend, when the black and white lines on the chart alternate.
However, such a confirmation of the trend may be late, and the bulk of the new movement can already be completed. But traders usually prefer to wait for such confirmation, which is a kind of compromise between risk and profit.
Most graphical analysis techniques can be applied to linear breakout schedules. They can have figures like “Double top” or “Head and shoulders”, trend lines and support / resistance levels.