Lloyds Banking Group PLC Chart | UK | 30-June-2011
Here is a technical chart of Lloyds Banking Group PLC, listed in UK. on daily time frame. I’ve used Doda-Donchian indicator and out of Ichimoku, I’ve taken just Kumo to get visible support and resistance levels.
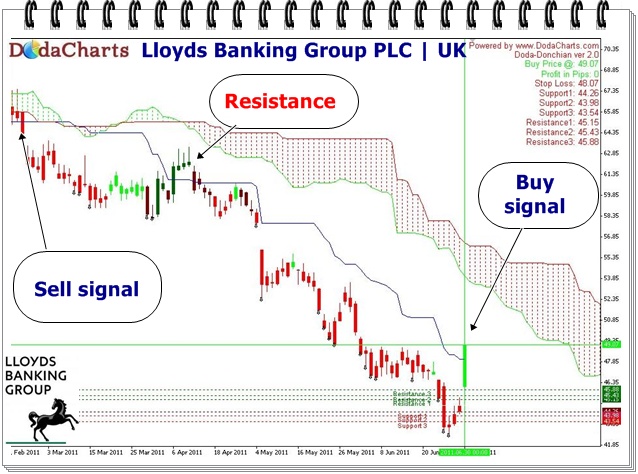
Doda-Donchian indicator gave sell signal on23-Feb-2011 @64. The proce also closes below kumo; thus clearly giving bearish kumo breakout. It moves southward direction for few weeks and then in the beginning of April 2011, it managed to cross Doda-Donchian line but failed to cross kumo – the great resistance for any stock.
Again, it started his downtrend journey. On 27-June-2011, it made its low @42.54. And after that, it started upward journey. In the last trading session, Doda-Donchian gave buy signal @49.07 as the price closes above Doda-Donchian line.
Now, the question arises, shall one take Buy call at this moment.?
Well, if you’re a believer of high-risk high-gain principle, you can take this call. But if you can wait for some time, I suggest let the price crosses kumo also, which has become strong resistance now. Once it crosses kumo, it will give bullish kumo breakout signal and will start its upward journey. It’s better to wait and watch at this stage.