Major support levels of Sensex & Nifty
I'm getting lots of queries from investors as we've witnessed some correction in Indian stock market last week. So, I'm posting technical charts of Sensex & Nifty to get major support levels. I'm using Ichimoku Kinko indicator in daily charts.
Let is first see the daily chart of Nifty.
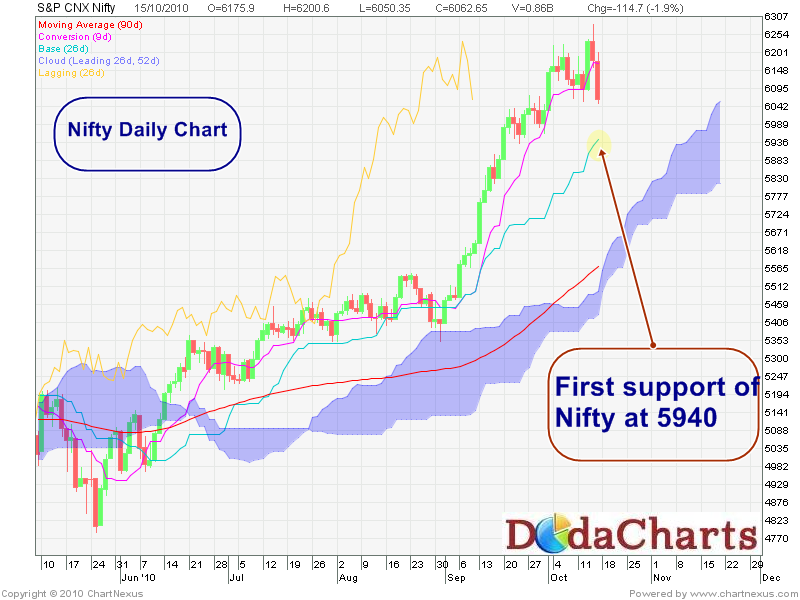
The price is well above kijun-sen line & Kumo. The future kumo is also bullish clearly stating that we're still in bull run. Kijun-Sen is currently around 5940 level. If Nifty closes below this level, just exit from your long-positions. That will be first sign of weakness in market. But do not take any short position. If Nifty & Chikou-Span (CS) closes below kumo, that will be right time to take short position. Will give you illustration on that if that happened.
Now, let us see the daily technical chart Sensex using Ichimoku indicator.
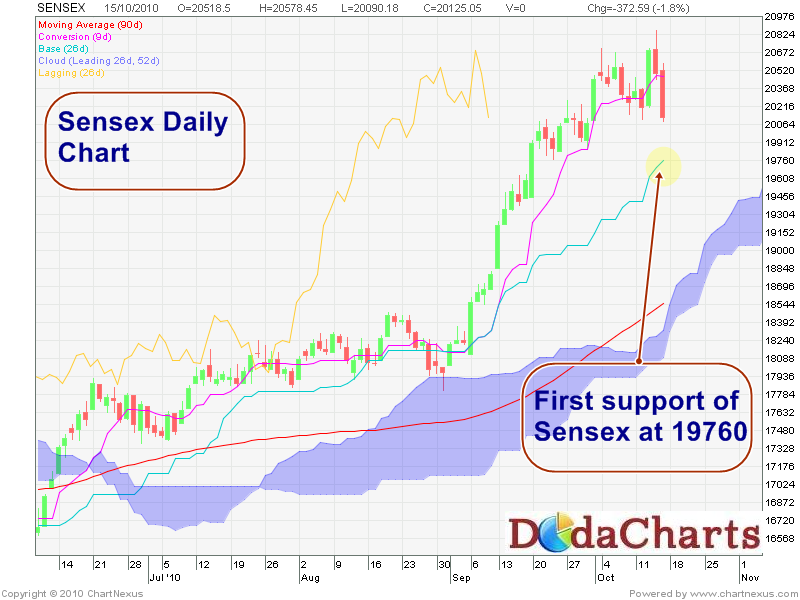
Here also, Sensex is well above Kijun-Sen line. The first support level of Sensex is currently at 19,760. So, make a strict stop loss of this level for your long-position.
If you've got any doubts on this article, please feel free to ask under comments section below.