Moving Average Envelopes
Introduction to Moving Average Envelopes
The simplest moving averages can be transformed into a new tool – envelopes of moving averages. This tool, like the Bollinger Bands, is used to determine the boundaries of the current price movement.
Formula of Moving Average Envelopes
The indicator consists of three bands:
The upper band of the envelope: Moving Average Upper Band = Moving Average + (K / 100) x Moving Average
Where K is the percentage of the price at which the sliding moves upwards
Lower band of the envelope: Moving Average Lower Band = Moving Average – (N / 100) x Moving Average
Where N is the percentage by which the moving average moves down.
Sample chart using Moving Average Envelopes
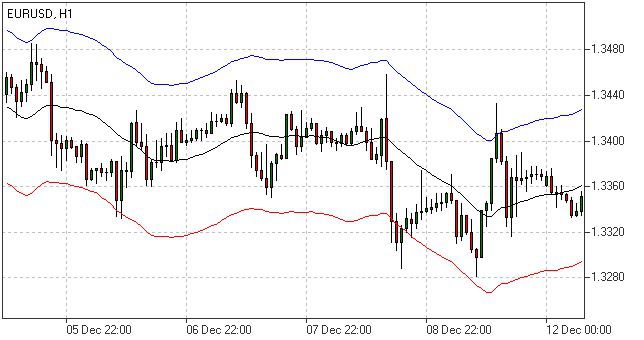
Description of Moving Average Envelopes
The envelopes moving averages (Moving Average Envelopes) consist of two moving average (which may be considered as a simple exponential or on a different principle), displaced one up and the other down by a percentage (called envelope coefficient).
Sometimes we draw the third line – the central sliding from which there is a shift.
For example, a 2% envelope of moving averages will look like 2 lines, the first one – sliding shifted by 2% up, the second – 2% down. It is believed that the envelope defines the boundaries (upper and lower) of the normal price fluctuation of the currency pair.
The principle of using the moving average bands is as follows: the price always returns after some fluctuations to its main trend (to its central moving average). This is due to the fact that the more the price differs from its main trend, the more traders fix the profit, returning the price to the “normal channel”.
The greater the volatility of the analyzed market, the more the boundaries of the bands need to be selected.
How to use Moving Average Envelopes
There are a number of methods for using envelopes:
- After careful selection of the bias coefficient, the use of the upper line as a resistance line, and the lower one as a support line. The corresponding tactic is selling at the top line and buying at the bottom.
- Use of the breaking of bands as the identifiers of the development of the movement. Sometimes when using the signals of the tactics of crossing the price of your own moving average, Moving Average Envelopes is used as a filter. Thus, the purchase, for example, is carried out when the price of the currency first crosses its moving average up, and then the upper envelope strip.
- Selling in the opposite case: when the price first crossed its sliding down from the top, and then the bottom of the envelope. Such tactics significantly reduces the number of false signals (since the trader does not enter the market in the outset when the price is inside the envelope), however in the case of this trend the correct signal comes later and the trader loses part of the trend movement (equal to or greater than the envelope coefficient). This tactic is well described in the book LeBo, Lucas “Computer analysis of futures markets.”
As in the case of determining the parameters of a normal moving average, a trader becomes preoccupied with a dilemma – either to receive more false unprofitable inputs or to skip a part of the trend.
The first tactic is used mainly for short-term trading, the second – for medium and long-term.
Disadvantages of Moving Average Envelopes
Like any indicator built on the basis of moving averages, envelopes of moving averages are late. Slip envelopes are not able to adjust to the current volatility of the market, such as the Bollinger Bands.