Moving Average in Trading » Tutorial
The moving average is an indicator reflecting the average valuation of a security over a given period. Its ease of use and interpretation make it a popular tool for chartists.
A frequently used aspect of technical analysis is the Moving Average or, in other words, the moving average. What can you deduce from this indicator? And how can you use the moving average when making your investment choices? In this article dedicated to the moving average, discover the following topics:
What is the moving average?
The moving average is an indicator frequently used by investors because these averages often provide support or resistance. The simple moving average and the exponential moving average are the most used moving average indicators. This indicator can be used with other indicators such as RSI and MACD.
The 50 and 200 day moving average
The simple moving average, or the SMA for short, is nothing more than the average price over a certain period. The SMA is calculated by adding all the closing prices in this period and dividing by the number of days. The most used period is the 50 and 200 day moving average, with candles on a daily basis. If you want to use this indicator, I advise you to use one of these two timeframes. As already said, the more investors use the same indicator, the better the indicator performs.
In addition to the SMA, the exponential moving average or EMA is often used when investors talk about the 50 and 200 day moving average. the EMA gives more importance to recent prices. So it will be up to you to choose. In general, the EMA and the SMA are more or less similar.
How to use these averages to choose a strategy?
First, the moving average indicates the direction of the trend. A rising average is a positive sign. A falling average indicates a downward trend. As the 50-day average covers a shorter period, this line is generally more mobile.
The 200-day average is a good instrument for predicting highs and lows. As many investors use this indicator, the price often bounces off this line. Of course, not all highs and lows are around the 200-day average. Nevertheless, with the graph below, it is clear that this indicator can indeed have an influence.
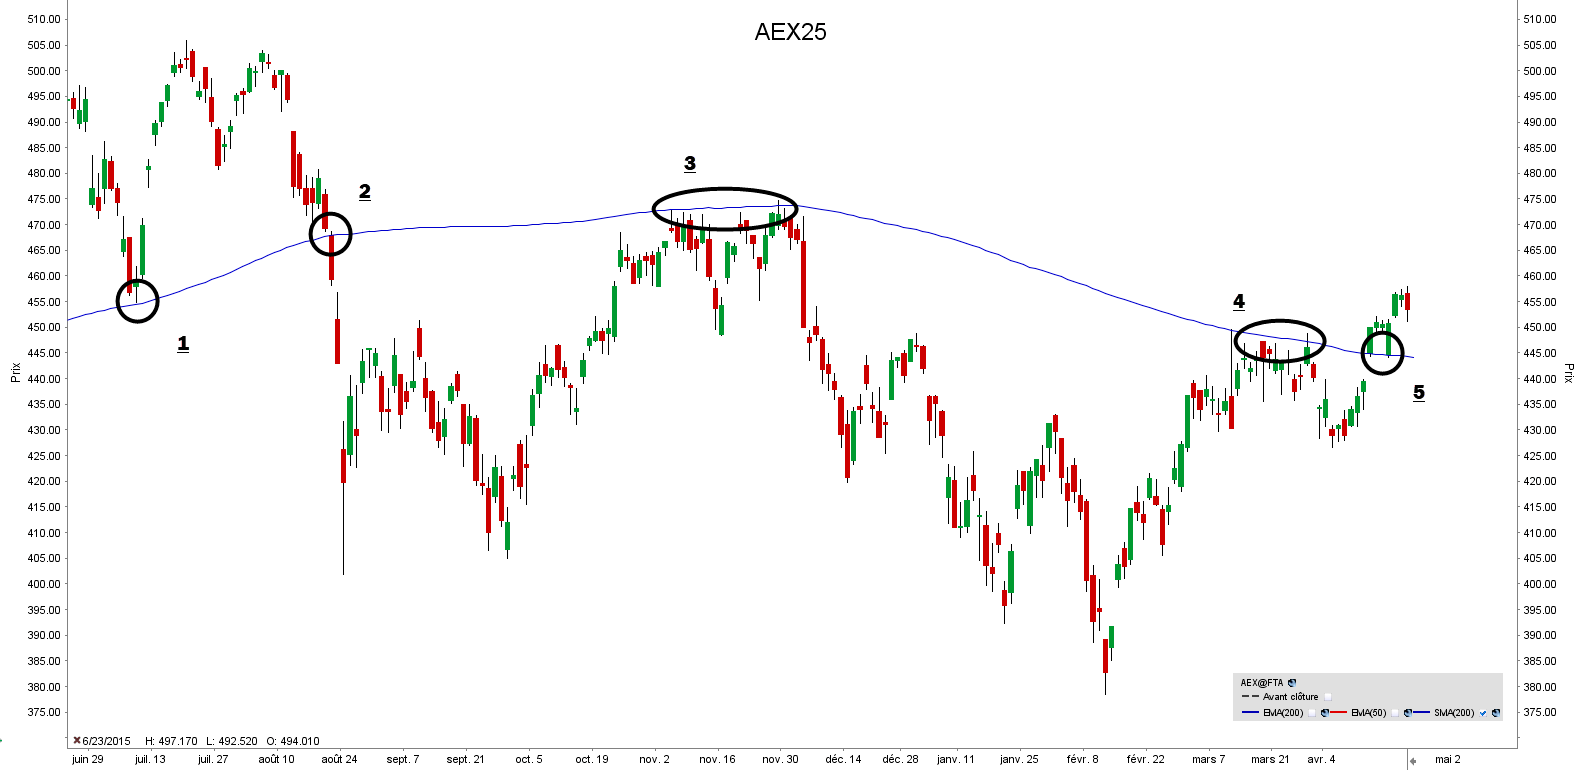
This chart shows the price development of the AEX index over the past year. In this period, the index approached the 200-day average five times. All five times, the influence of this line was clearly visible.
Below point 1, the CAC40 index found support around this average as the index rose sharply. Under point 2, the average was discontinuous. Then, an unprecedented strong move followed down. Under point 3 and under point 4, the SMA has clearly provided resistance. Finally, below point 5, the index opens with a gap above the 200-day average. Then the index drops to this line, finds support twice and rises again.
In the example above, it is clear that the 200-day average is therefore indeed an important indicator for investors. I advise investors to always add this indicator, along with the 50-day average, to their chart. The 200-day average is attractive to use for investors who hold mid-to-long positions.