Nasdaq 100 Technical chart | 18-Dec-2012
Let us discuss the technical chart of Nasdaq 100.
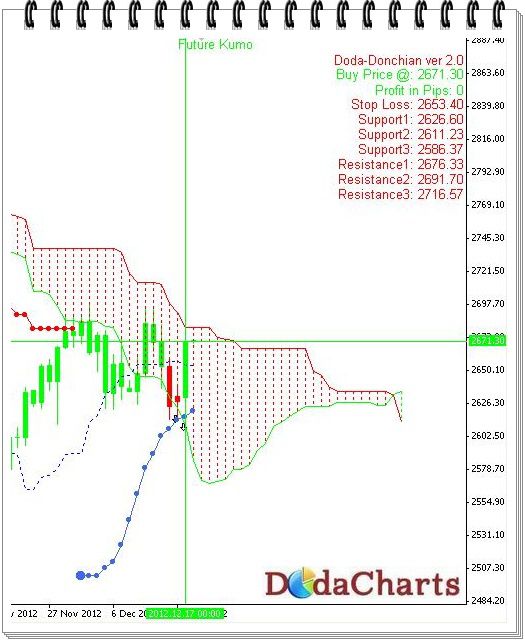
The main level to watch for Nasdaq is 2647.26. As long as Nasdaq is trading above this level, do not miss any long position. 2660 is also a good support for Nasdaq.
If it closes below 2647.26, book your profits and exit. You can take short position also there.
On the upside, 2679.53 and 2727.96 are key resistance levels. Watch them carefully.