Nifty Technical Chart | 02-Nov-2011
Let’s analyze the technical chart of Nifty and see it trend for coming days.
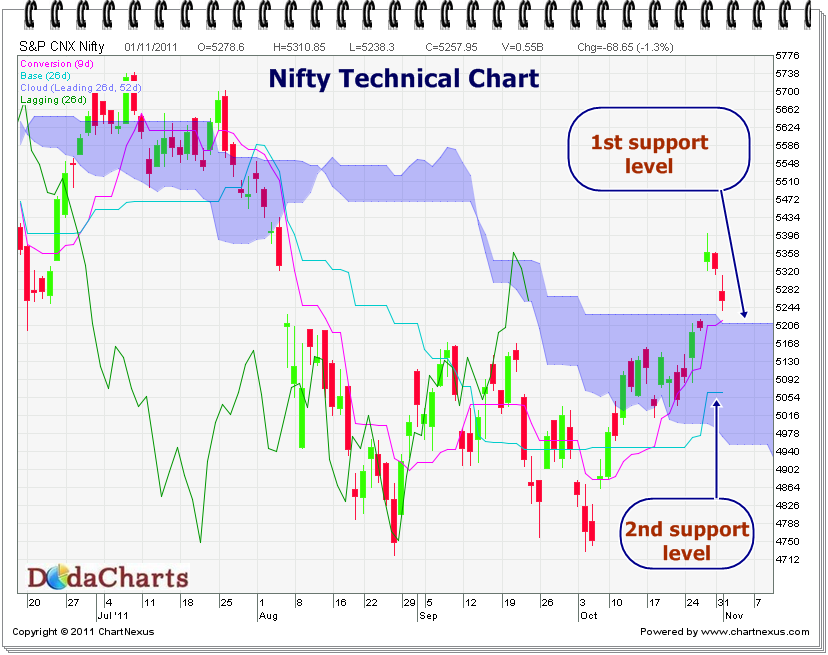
In the last trading session, we’ve witnessed a change of 1.3% (68.65 points) in Nifty. Now, the question arises, where will be Nifty in coming days. The answer is in its technical chart using ichimoku indicator. As indicated by the chart, the price is trading above kumo, but the Kijun-sen line is flat.
Whenever the Kijun-Sen line is flat, it will always attract the price – that’s the golden rule of Ichimoku indicator.
So, the price will get support first on kumo i.e. at the level of 5210 and then at 5065. Watch these levels carefully. Chikou-Span (CS) line is also below CS. So, there is no clear bull signal in Nifty yet.