Nifty Technical Chart | 10-Dec-2011
Let us analyze the technical chart of Nifty with ichimoku Kinko Hyo indicator.
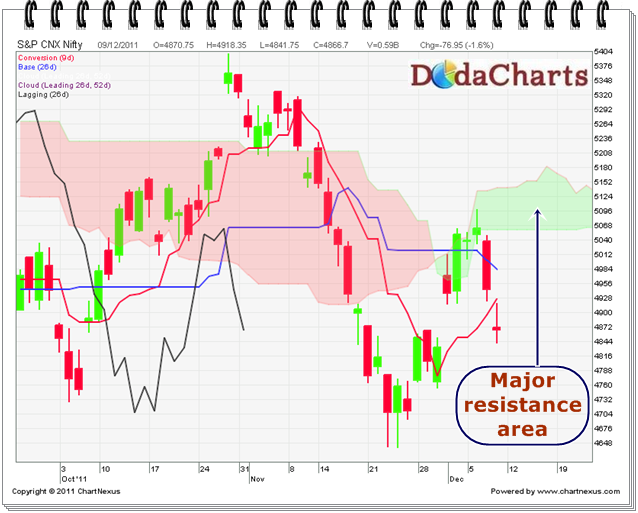
In this week, Nifty tried to cross kumo, but failed; leading to correction. So, Kumo is the major resistance at this point for nifty, which is in the range of 5060 to 5143. Take long positions in Nifty ONLY above these levels. Below these levels, there is much room for further correction.