Nifty Technical chart | 14-June-2012
Below is the technical analysis of Nifty, using ichimoku kinko hyo indicator.
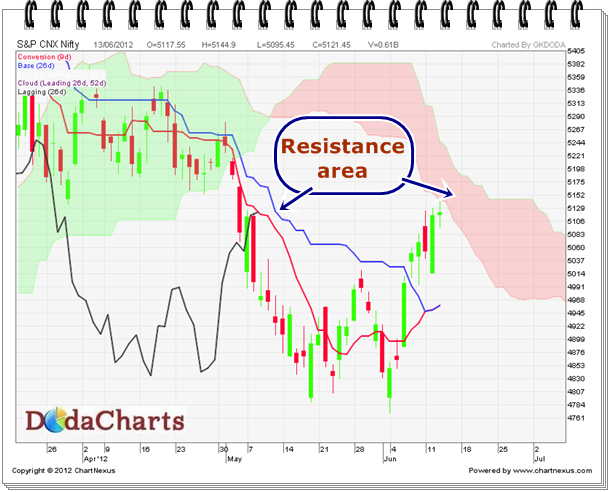
The day Nifty managed to closed above kijun-sen line @5049, it started is immediate uptrend. But, if you look at the chart, it’s near kumo, which is its main resistance area. Chikou-Span line is also going to face resistance at kijun-sen line.
On weekly chart, 5138 is the tough resistance ahead. Crossing it, it can lead to 5355.
Take your positions accordingly.