Nifty technical chart | 26-Oct-2011
Here is a technical chart of Indian stock market indice Nifty using Ichimoku indicator.
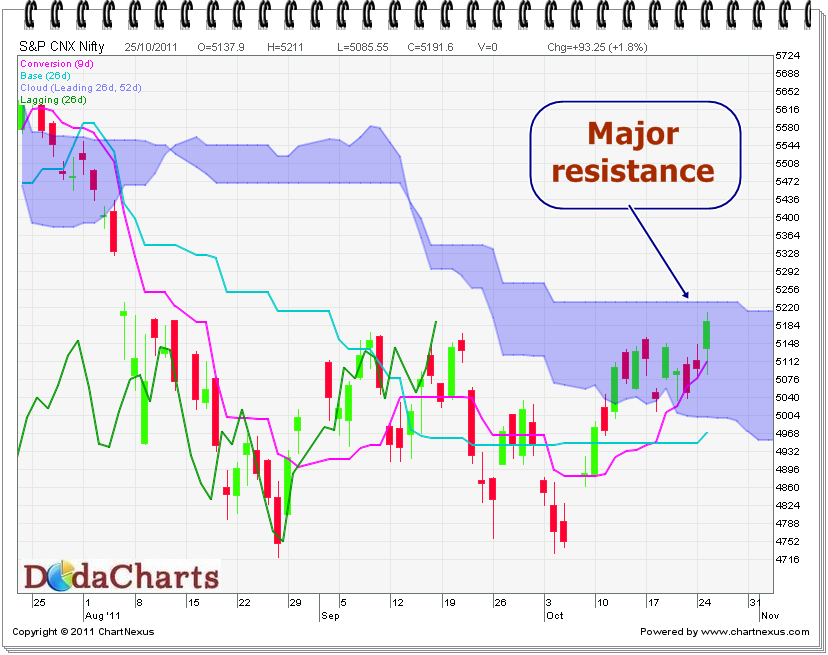
On one side, DowJones has crossed Kumo (as explained in my previous article) and on other side, Nifty is preparing to touch kumo today. Most probably, Nifty will touch the level of 5232. It’s difficult to close above this level at one go. But surely, it’s setting stage for it kumo breakout. Once that happens, one can take long position in Indian stock market for the next leg of bull market with a stop loss on kumo.
We’ll analyze Sensex chart also in next few days as it’s still far from kumo level.