NTPC Technical chart | 07-Dec-2011
Here is a technical chart of NTPC Ltd., listed on Indian stock exchange, with ichimoku Kinko Hyo indicator.
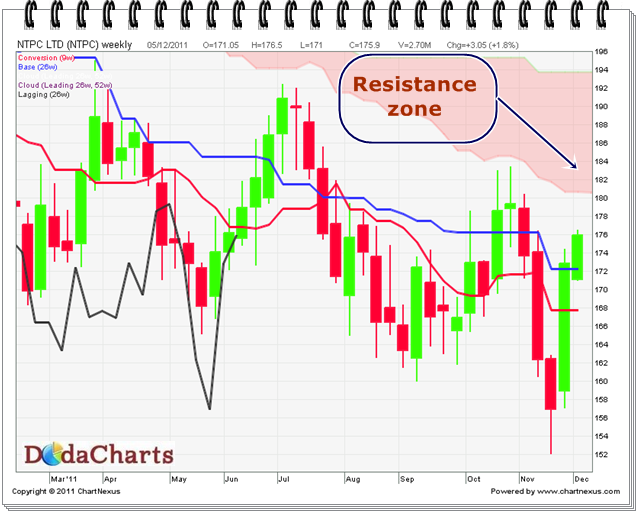
NTPC is about to enter its high resistance zone which is in range of 180.50 to 193.70. Do NOT take any long position here. Wait till the price closes above 193.70 and invest then. If you’ve already taken long position, book your profits now.