NTPC Technical Chart using Ichimoku
NTPC on NSE India was trading between the range of 192-202 for most of the time. Now, it has come to Rs.220. Let's analyse the reason for it and future prospects of this company using Ichimoku Kinko technical indicator.
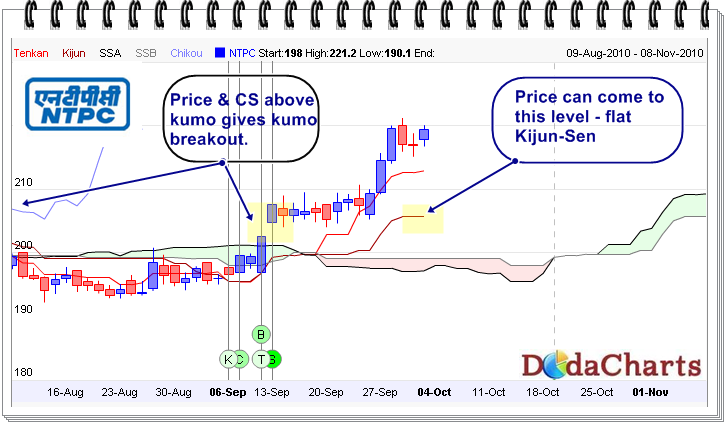
On 13th Sep. 2010, price closes above kumo, which was acting strong resistance for quite some time. At the same time, chikou Span (CS) also closed above the price – resulting in Kumo breakout.
The price started rising above along Tenken-Sen line. It's now trading at around Rs.220 level.
One important thing to notice here is that although price is rising, but Kijen-sen line is flat.
**Whenever Kijun-Sen line get flat, the price always gets attracted to it. **
That means, the price of NTPC can come down to Rs.205 level. If it sustains there, it will move upward again. If not, it will come down more around Rs.198, which is first line of Kumo.
Got any doubt? Please share your thoughts on this topic in below comments.