NZDJPY Technical chart | 30-Oct-2017
Below is the technical chart of NZDJPY explained with different technical indicators.
NZDJPY Technical Chart
I’ve used Doda Donchian, Doda-Bollinger Bands, Ichimokuand ADX Candles in this chart. Time frame used is H4.
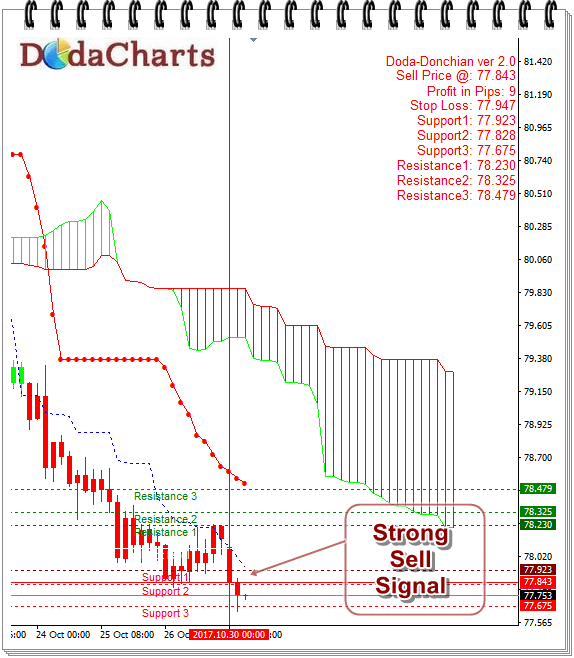
Just like NZDUSD forex currency pair movement, NZDJPY also has started another leg of downtrend from 77.843
All our famous and tested technical indicators, including Doda Donchian has already given Sell signal and the price is trading below Ichimoku Kumo and Doda Bollinger bands.
Major Support Levels for NZDJPY
77.947
77.828
77.675
Major Resistance Levels for NZDJPY
78.230
78.325
78.479