NZDUSD Technical chart | 13-Dec-2011
Let us see the technical chart of NZDUSD using Doda-Donchian and Doda-Bollinger Bands.
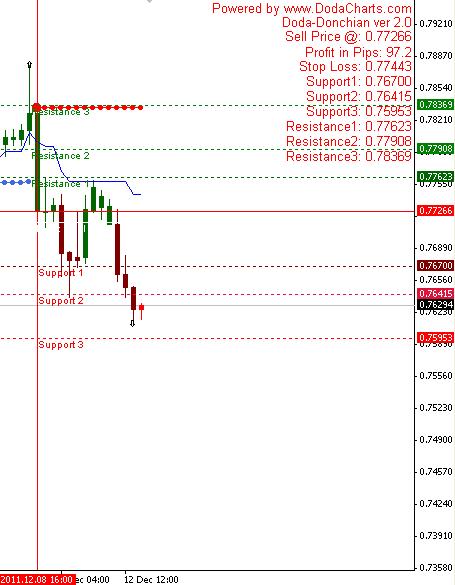
Although both Doda-Donchian and Doda-Bollinger Bands has given sell signal on this currency pair @0.77266, it is trading near its strong support zone. I would suggest to take short position after it crosses this support zone. The zone area is from 0.76448 to 0.7605. Do not take any position now.