NZDUSD Technical chart | 30-Oct-2017
Below is the technical chart of NZDUSD explained with different technical indicators.
NZDUSD Technical Chart
I’ve used Doda Donchian, Doda-Bollinger Bands, Ichimokuand ADX Candles in this chart. Time frame used is H4.
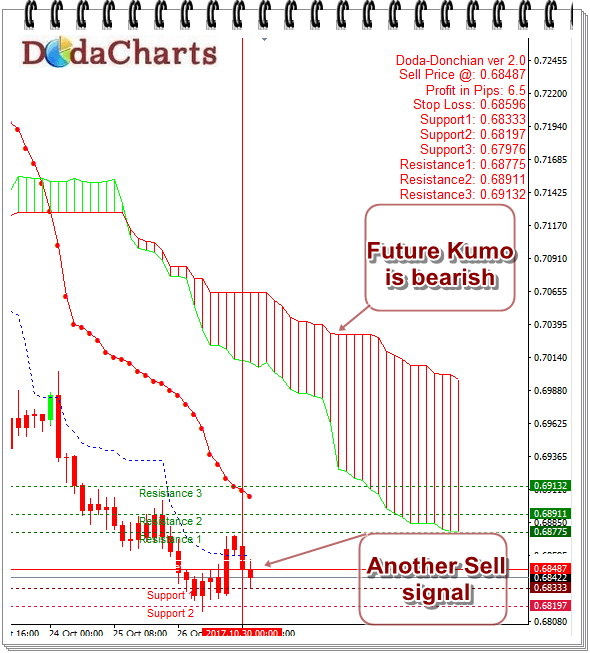
NZDUSD started its downtrend on 19-Oct-2017 from 0.70960 and rests around 0.68197. In the last trading session, it tried to move little bit upward but bearish signals pulled it down.
As a result, another leg of downtrend has been started in this forex currency pair chart and one has the opportunity to take Short sell @0.68487. Doda Donchian has already given Sell signal and the price is trading below ichimoku Kumo and Doda Bollinger bands.
Major Support Levels for NZDUSD
0.68333
0.68197
0.67976
Major Resistance Levels for NZDUSD
0.68775
0.68911
0.69132