Parabolic SAR ► How to trade in right way
Among the most used technical trend indicators , there is the parabolic Sar indicator reacting both according to the evolution of the price, but also that of time. In other words, it helps determine the direction of an asset's price and when prices change direction. When the prices are stable, the indicator moves horizontally and this will not challenge the trend. When the SAR crosses the price, then it causes a trend reversal.The stronger the movement, the faster the points that make up the Parabolic SAR indicator will move apart and approach the price.
The parabolic SAR has three main functions.
- First, it highlights the current price direction or trend.
- Second, it provides potential entry signals.
- Third, it provides potential exit signals.
Features of the Parabolic SAR Technical Indicator
It was in his book “New Concepts in Technical Trading Systems” published in 1978 that Welles Wilder first described the fundamentals of his parabolic SAR (Stop And Reverse) technical indicator. This indicator combines price and time components with the aim of generating potential buy and sell signals. It is an effective tool for defining where to place stop loss orders.
The Parabolic SAR indicator has a smooth parabola-like shape with the idea that dots of a red and green color on an asset's price chart help identify reversal areas or breakpoints and inversion (Stop And Reverse). It is thus almost similar to the moving average, but moves with the acceleration of the prices and changes its position following the price chart depending on the downtrend or uptrend. Its purpose is then to clearly show the stoppage and the reversal of a security graphically.
Parabolic SAR Technical Indicator Calculation Method
To calculate the stop and reverse parabolic indicator, we use the following formula:
SAR(n) = SAR(n-1) + Acceleration factor x [(extreme point marked by position) - SAR(n-1) ]
The extreme point of a position is presented as the highest point that has been observed since the long position was taken. In the case of a short position, this is the lowest point.
Interpretation of Parabolic SAR
In a chart, the Parabolic SAR technical indicator reacts at the same time to the evolution of the price on one side and the time on the other. This means that if the price hardly evolves then the parabola will evolve horizontally and this will not call into question the trend. On the other hand, a crossover of the price with the parabolic SAR shows a trend reversal and all the more so as time progresses, the parabola approaches the price which then allows traders to change their stop loss.And the more powerful the movement, the more there will be a deviation and a rapid rapprochement of the price with the points of the indicator. Thus, if a downtrend materializes, the indicator will quickly follow, offering the possibility of exiting a position as soon as a corrective movement occurs.
Interpretation with trends
Once the parabolic SAR value is found, the indicator then follows the trend:
- In the case of an uptrend, the parabola is below price by one point.
- In the case of a downtrend, the parabola is above price by one point.
There is a trend reversal when prices touch the parabola and move from below to above the SAR indicating that it is necessary to change position.
Trading signals with the Parabolic SAR
- When prices cross the parabola upwards, this is a buy signal;
- When prices cross below the parabola, this is a sell signal.
How to trade using the Parabolic SAR
The good thing about the Parabolic SAR is that it is very easy to use, unlike other technical indicators. But actually REALLY simple.
Basically, when the dots are below the candles, it's a BUY signal.
When the dots are above the candles, it is a SELL signal.
Easy ? Yes indeed…
This is probably the easiest indicator to interpret as it assumes the price is going up or down. That said, this tool is best used in fast-moving markets that experience long periods of upswings and downturns.
You DO NOT want to use this tool in an unstable market where the price movement is sideways, seesaw.
How to trade with Parabolic SAR
The basic usage of the Parabolic SAR is to buy when the dots move below the price bars (signaling an uptrend) and sell (short) when the dots move above the price bars (signaling an uptrend). downward trend).
This will result in constant signals, as the trader will always have a position. This can be good if the price fluctuates a lot - producing a profit on every trade - but when the price only makes small moves in each direction, these constant signals can produce many losing trades over a period of time.
Therefore, it is best to analyze prices over a long period of time to determine if the trend (if there is one) is up or down. Another indicator, such as a moving average or trendlines, can also be used to establish the overall direction of the trend. If there is a trend, only take signals in the direction of the overall trend. For example, if the trend is down (according to your analysis), only take “short” trading signals (when the dots swing above the candles), then exit them when the dots swing below the bars of price. In this way, the indicator is used for its strength: capturing trend movements.
If you have defined an overall trend, it is hoped that you will not have to worry about the weakness of this indicator: the absence of a trend leads to contradictory signals that will make you lose.
How to use Parabolic SAR to exit trades?
You can also use the Parabolic SAR to help you determine if you should close your trade or not. Parabolic SAR can therefore work as an output signal in most cases.
Take the example of the chart below on gold (weekly price):
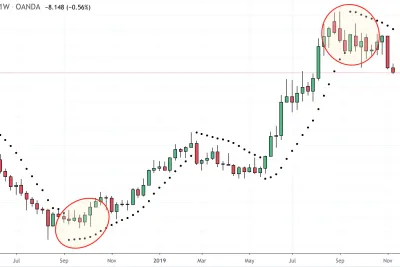
In September 2018, if you were short on gold since the beginning of 2018, you will notice that the SAR starts to form points under the prices: it is a sign of a trend reversal and it is the good time to close the trade (and possibly buy the market). Before the market really goes up again, it took 4 or 5 weeks (4 or 5 SAR points on the chart).
In the opposite way, in September 2019, dots above the candles are formed: this is a sign of an imminent downward reversal. If you're "long" in the market, it's a good time to get out!
Advantages and Disadvantages of Parabolic SAR
The main advantage of the indicator is that during a strong trend, the indicator will highlight that strong trend, thus allowing the market trader to stay in the trend. The indicator also gives an exit when there is a move against the trend, which could signal a reversal. Sometimes it ends up being a good exit, as the price reverses. Other times it is not a good exit as the price immediately starts to move in the direction of the trends.
The major downside of this indicator is that it will provide little analytical analysis or good trading signals when the market is on an upswing. Without a clear trend, the indicator will constantly swing above and below the price. This type of price action can last for a long time. Therefore, if a day trader relies solely on the Parabolic SAR for trading signals, then it could be a long lonely time!
This is why it is recommended that traders learn to identify the trend first, in order to avoid unsuccessful trades in the absence of a trend, and thus focus on interesting entry or exit points given by the SAR parabolic.