Parabolic SAR Introduction
The Parabolic SAR indicator was developed by Wells Wilder for the purpose of confirming the direction of the trend, the onset of a correction phase or lateral movement, as well as determining possible points of closing positions.
The underlying principle of the indicator can be described by the phrase “Stop and Reverse“. The indicator displays some dots on chart screen itself rather than on a separate window like other technical indicators – MACD, RSI, Stochastic etc.
But the parabolic SAR indicator cannot be used to determine the trend.
Calculation of Parabolic SAR
To calculate the Parabolic indicator, the acceleration factor is multiplied by the difference between the minimum / maximum price value and the previous SAR period. Further, the result with the falling SAR is subtracted from the previous SAR value, and when growing, it is added to the SAR value of the previous period.
P (t) = P (t-1) + AF x (EP (t-1) -P (t-1)) ,
Where:
P (t) is the current value of the indicator;
P (t-1) – value of the indicator in the previous period;
AF – acceleration factor, grows in increments of 0.02 on the interval [0.02; 0.2];
EP (t-1) is the minimum / maximum value of the price in the previous period.
How to use Parabolic SAR?
When using the Parabolic Indicator, both its location relative to the price chart and the acceleration factor that grows with the trend development should be taken into account. Despite its popularity as a graphical analysis tool, the indicator has a number of limitations and can give false signals in the case, for example, of the often changing market dynamics.
The Parabolic SAR indicator provides the following signals:
Confirmation of trend
- Located below the price chart, the indicator confirms the presence of an uptrend;
- Located above the price chart, the indicator confirms the presence of a downtrend;
Determination of the moments of closing positions
- If the price falls below the indicator in conditions of an uptrend, you should close long positions
- If the price is higher than the indicator in conditions of a downtrend, short positions should be closed
The significance of the signal is determined by the acceleration factor. The acceleration factor increases every time the current closing price is higher than the previous one in the case of a bullish trend and below the previous one in the case of a bearish trend. It is believed that the Parabolic indicator is more reliable if the price and the curve of the indicator move in parallel, and is less reliable when they begin to approach each other.
Trailing stops is a common method of using parabolic SARs. For example, if you hold a stock in the hands and set a tracking stop below the current share price, the stop price will rise when the stock goes up. If the price starts to slide down to the stop price, the trailing stop will be executed and sold to protect the profit to prevent further losses. If the price continues to rise, the trailing stop will not be executed and the stop price will rise again with the price of the securities.
Parabolic SAR Example
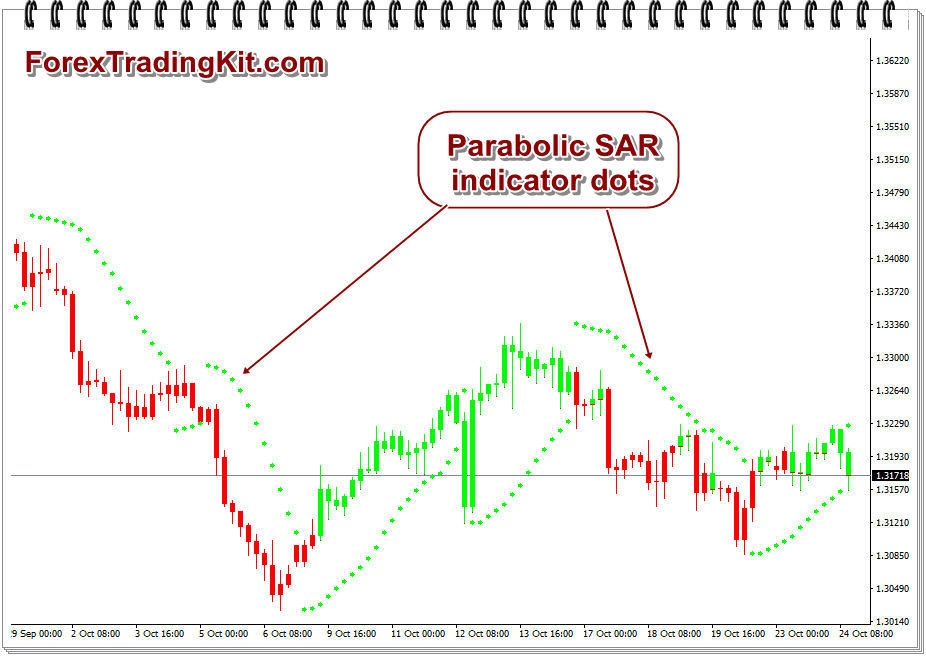
GBPUSD currency pair chart with Parabolic SAR indicator
Above chart is the GBPUSD currency pair plotted with Parabolic SAR technical indicator.
Note:
The green dots are below the price when currency pair is in uptrend and
below the price when the currency pair is in the downtrend.
Almost all forex trading software, stock market trading software or commodity market trading software provides Parabolic SAR indicator. The above chart was taken from MetaTrader 4 software.
Variant of Parabolic SAR indicator
As you can see from the above chart, that many times this indicator gives false signals. So, it’s not possible to rely on it as it is.
I’m here showing you one variant of Parabolic SAR indicator, which also shows dots on chart screen and interpretation is same, but it uses different calculations.
Below is the same GBPUSD currency pair which was displayed above with original indicator. But this time, I’ve used variant indicator called Modified version of Parabolic SAR.
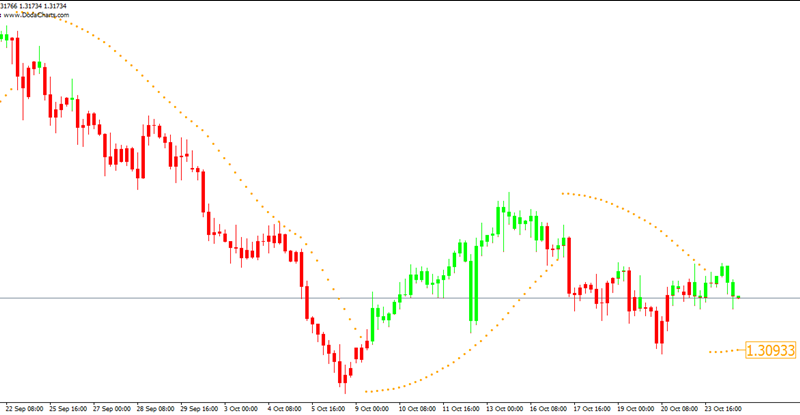
Note how confusing was the first chart and how clearly is the 2nd chart.
Download Parabolic SAR variant indicator
You may download the variant of Parabolic SAR indicator from here for MetaTrader 4 software. The zip file contains MQL4 source code and EX4 compiled file.
Hope you like the above tutorial on Parabolic SAR. If you’ve any doubts about it, please share in the comments section below.