Parabolic SAR Technical Indicator Tutorial and Examples

The purpose of the parabolic system – to determine the tolerance within which price movement possible in order to stay in the current trend.
Initially the system was designed as a reverse, that is, at any time, it was assumed that the system is either in ascending or in a downtrend and must be opened in each case either long or short position. Current systems of evidence, in particular, and the original name of its main indicator – SAR (Stop and reverse price – price Stop and Reverse). However, in the future, due to the fact that the market is in a pronounced trend only short periods of time and the constant opening and changing positions is fraught with multiple losses, the system began to recommend to be used in conjunction with other indicators and methodologies.
General description
In the case of an uptrend, at any given time by the modified exponential determined indicative price – SAR, below which should not fall real price. Once the real price falls below the indicative, the system automatically assumes that the trend has changed in the descending and SAR indicates the maximum price above which should not raise the real price. Thus, a sufficient number of the analyzed period, the system automatically determines the direction of the trend and provides value for money, for a protective order.
Primary direction
The parabolic system automatically determines the direction of the market by any stretch than the first, therefore, a sufficient number of periods for analysis, given the primary direction of the market is irrelevant. To start can be determined arbitrarily. Necessary adjustments will occur automatically.
As the maximum and minimum prices for the primary direction is recommended, respectively, the maximum (max High) and minimal (minimum Low) these periods. The primary SAR – obtained for periods of at least in the case of the upward trend, and the maximum in the case of the downtrend.
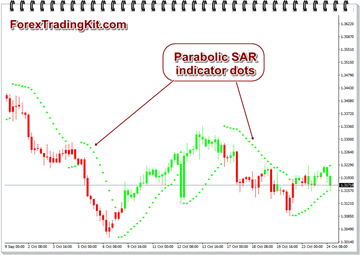
The indicator is constructed on the price chart. On This indicator is similar to the moving average, with the only difference that Parabolic SAR moves with higher acceleration and may change its position relative to the price. On the “bull market” (Up Trend) indicator is below the prices on the “bearish trend” (Down Trend) – above.
Parabolic SAR is an outstanding indicator for providing exit points. Long positions should be closed when the price sinks below the indicator, and short – when the price rises above the Parabolic SAR. That is, you must keep track of the direction of the Parabolic SAR and hold open positions in the market only in the direction of the movement. Often, this indicator is used as a trailing stop line (trailing stop).
If the long position is open (ie price above the Parabolic SAR), the line will go up, no matter what direction the price. The amount of movement Parabolic SAR lines depends on the magnitude of the price movement.
For long positions:
SAR (i) = SAR (i – 1) + ACCELERATION * (HIGH (i – 1) – SAR (i – 1))
For short positions:
SAR (i) = SAR (i – 1) + ACCELERATION * (LOW (i – 1) – SAR (i – 1))
where:
SAR (i – 1) – the value of Parabolic SAR indicator on the previous bar;
ACCELERATION – acceleration factor;
HIGH (i – 1) – the highest price in the previous period;
LOW (i – 1) – the minimum price for the previous period.
The indicator value increases if the price of the current bar is higher than previous bullish and vice versa. This will double the acceleration factor (ACCELERATION), which would cause Parabolic SAR and the price. In other words, the indicator approaches the price, the faster, the faster the price rises or falls.
In simple words, buy when price closes above Parabolic SAR and sell when prices closes below Parabolic SAR.