PNB Gilts Ltd. Technical chart | 06-Dec-2011
Let us discuss the technical chart of PNB Gilts Ltd., listed on Indian stock exchange, using ichimoku Kinko Hyo indicator.
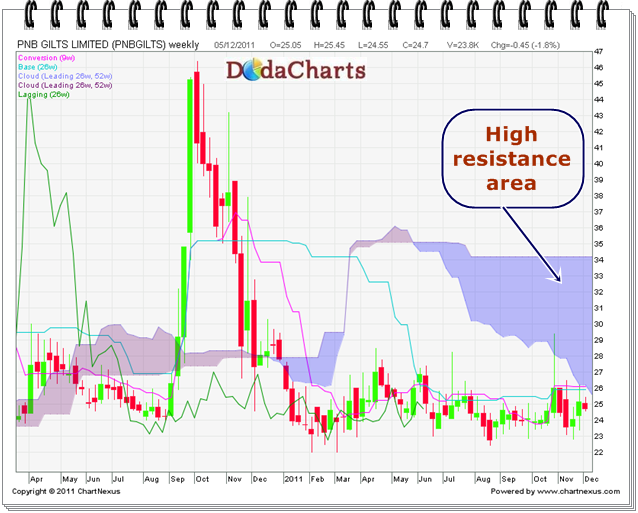
This is the technical chart on weekly time frame. This was necessary to get the better picture of its resistance area.
As you can see, the price is trading below kumo. So, just avoid the stock at this moment. Thereafter, it has to face tough resistance of kumo. The region of kumo is in the range of 25.61 to 34.22. One should take long position ONLY when it CLOSES above 34.22