Positive sign on DowJones Technical Chart | 22-Aug-2011
 DowJones chart has come to one interesting point, which I’m explaining below. I’ve used Ichimoku indicator on chart. Time duration – last 3 months.
In the last session, DowJones closed at 10854.65. Now, look at all the components of Ichimoku on the below chart.
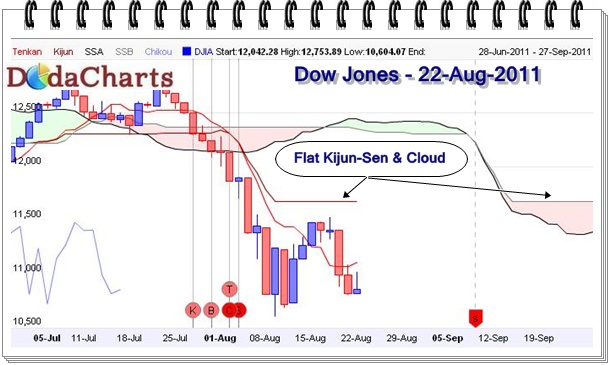
Bearish kumo breakout on 29-Jul-2011 and Tenkan Sen and Kijun sen crossed bearish on 02-Aug-2011. Chikou Span is also below kumo. So, everything is bearish and there is not even a bullish signal yet.
But if you look at chart carefully, you’ll observe, that even though, price is coming & trading down, Kijun-Sen line is flat. Not only that, Senkou-span A line is also flat. If you’ve gone through my tutorials on Ichimoku and my previous posts, you’ll remember that whenever Kijun-Sen or Senkou-Span A or B is flat, it will ALWAYS attract price.
So, in coming days, if price trades in range-bound or upward, it will go upto levels of 11,600. But if DowJones takes further dip from here, the kijun-sen line will also come down. So, for a trader, do not take any fresh shorts from here. Make strict stop-loss on your existing shorts.
Do not take any long position. I’ll suggest same when price and Chikou Span (CS) crosses cloud in bullish mode.