Pro Shares Ultra Short Gold Technical chart | NYSE | 15-Dec-2011
Let us analyze the technical chart of ProSharesUltraShortGold listed on NYSE with ichimoku indicator.
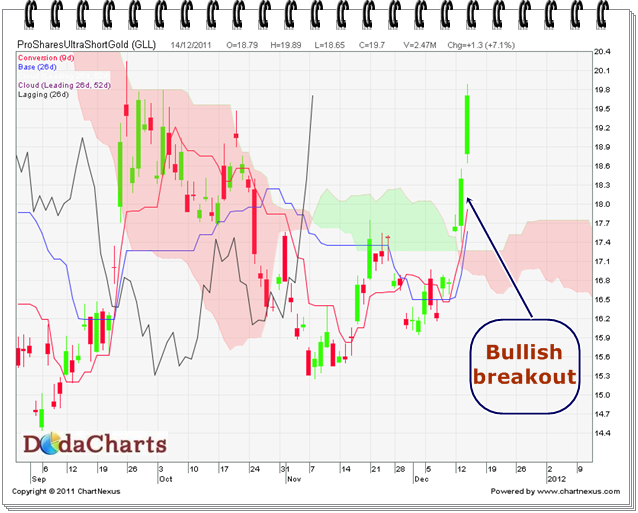
It gave bullish breakout @18.4 on 14-Dec-2011 as the price and chikou-span closed above kumo. It’s a clear buy signal. On a weekly chart, resistance is at 19.53, around which it is trading. So, watch this level carefully. One can take it as a stop-loss also. Crossing this, target is 25.56 in medium term.