Reliance Industries is in Downtrend | Technical Chart | 21-Mar-2012
Below is the technical chart of Reliance Industries, listed on Indian stock exchange, using Ichimoku indicator.
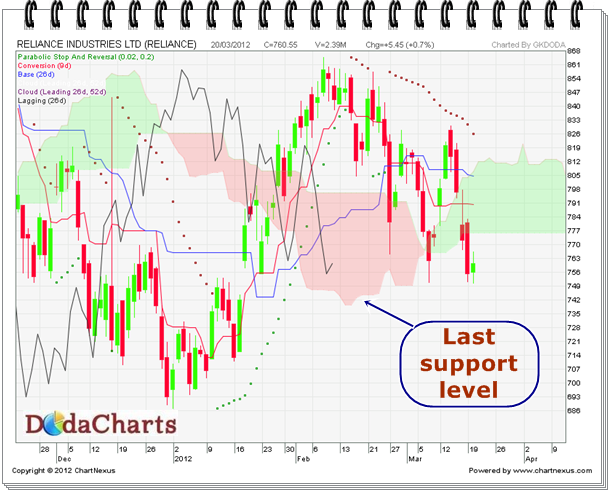 Price is trading below kumo, Tenkan Sen / Kijun sen crossed already taken place, Chikou-span (CS) line is trading inside kumo. All these factors clearly indicates that one should avoid this stock at this stage. There is not even a single positive factor for this stock. If chikou-span line closes below kumo i.e. 739, we might see free fall of this stock. On the upper side, the main resistance is at 776.