Reliance Industries Technical Chart on Ichimoku | 19-Nov-2011
Here is the technical chart of Reliance Industries Ltd., listed on Indian stock exchange with Ichimoku Kinko Hyo indicator.
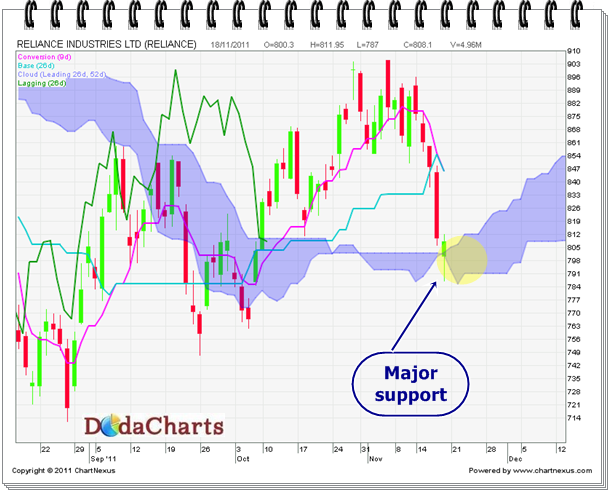
Yesterday, Reliance Industries Ltd. stock prices closed at 808.10. In intraday, it started trading below kumo but by the end of the trading session, it managed to close above kumo . So, kumo is acting as strong support viz. currently near 805 level. On the downside of kumo , major support is at 791.40. If Reliance Industries CLOSES below this level, take short position. Take long position ONLY when it closes above 840.20, which is kijun-sen level on weekly chart.