Reliance Industries Technical chart | 14-Dec-2011
 Let us discuss the technical chart of Reliance industries Ltd., listed on Indian stock exchange, with Ichimoku kinko hyo indicator.
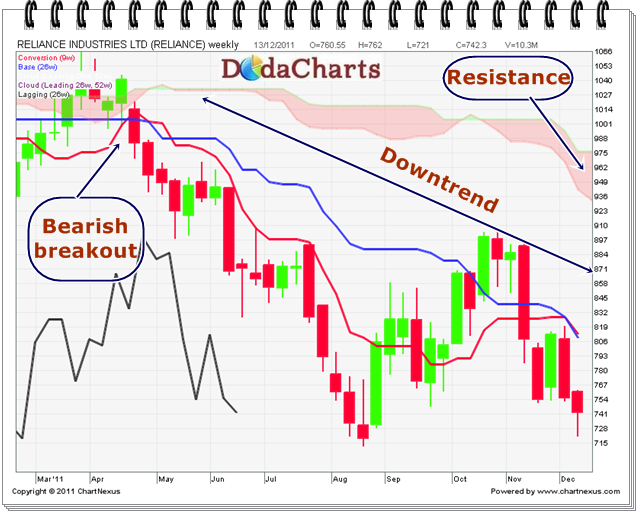
Ever since, the stock price closed below kumo on 29-Apr-2011 @970 on weekly chart, the price is moving downward. Few short bounce back and then failed. Different experts via different media are recommending to buy this share at different levels. But if you look at the chat, the price is still trading below kumo. So, where is the question of buying? The chart is weak and it is in bearish mode.
The immediate resistance is at 808.10 and then at 932.60 and 976. Only closing above these levels is a buy signal for this stock and not before that.