Reliance Power Technical Chart | 10 Feb 2011
Another good example to show the power of Ichimoku.
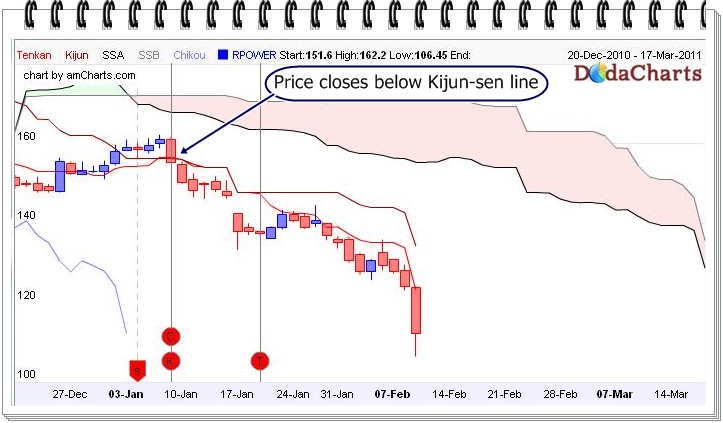
Reliance Power, listed in Indian stock market, closed below kijun-sen line @Rs.155.30 on 07-Jan-2011. As expected, that was the sign of beginning of downtrend. From there, it started moving downward and at the time of writing article, its previous close was Rs.112.20. The future kumo is also bearish and weak chart shows that it will correct further also.