Renuka Sugars Technical chart | 22-Dec-2011
Here is a technical chart of Renuka Sugars Ltd., listed on Indian stock exchange, with ichimoku kinko hyo indicator.
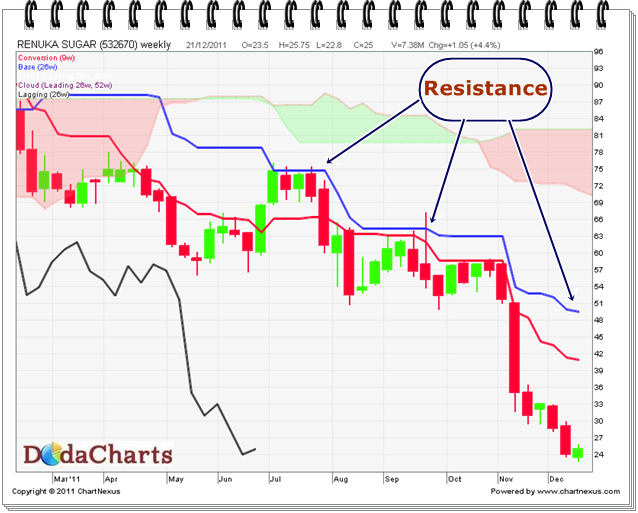
This chart is also in downtrend. Leave kumo, it tried to cross kijun-sen line several times, but faced string resistance there. Kijun-sen line is blue line in the above chart. So, do not make hurry to buy the stock even at these levels. Wait for it closing above kijun-sen line to buy it i.e. above 50. Next resistance will be at 70-82.