Research in Motion technical Chart | Nasdaq | 02-Dec-2011
Let’s see what’s inside the technical chart of Research in Motion (RIM), listed on Nasdaq, using ichimoku Kinko Hyo indicator. I’ve used its weekly time frame chart for better understanding of trend.
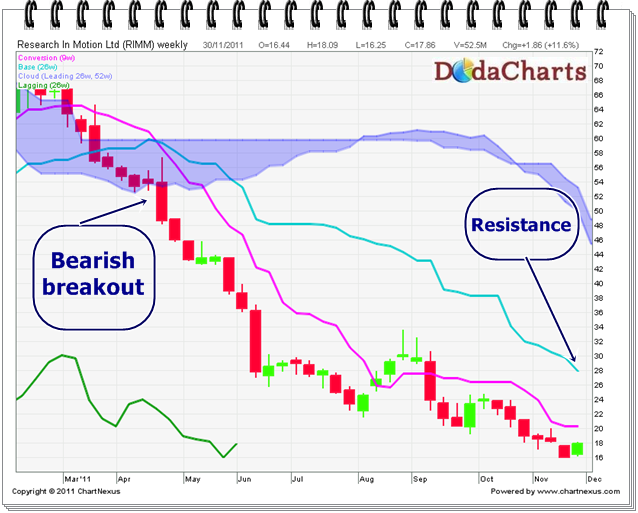
The stock has given a bearish breakout on 29-Apr-2011 @48.65. From there, it started its downward journey and not taking any support. Still it’s trading below kumo, below tenkan-sen line, below kijun-sen line and Chikou-Span (CS) line is also below kumo. All the factors are negative. There is not even a single positive sign for this tarde.
So, avoid this stock for investment till it closes above 27.78 for a target of 45.33