Rise and Fall of D B realty Ltd.| Technical Chart | 24-Nov-2011
Below is the technical chart of D B Realty Ltd, listed on Indian stock exchange. The stock is been news for a while because of charges in 2G scam. I’ve used here ichimoku Kinko Hyo indicator.
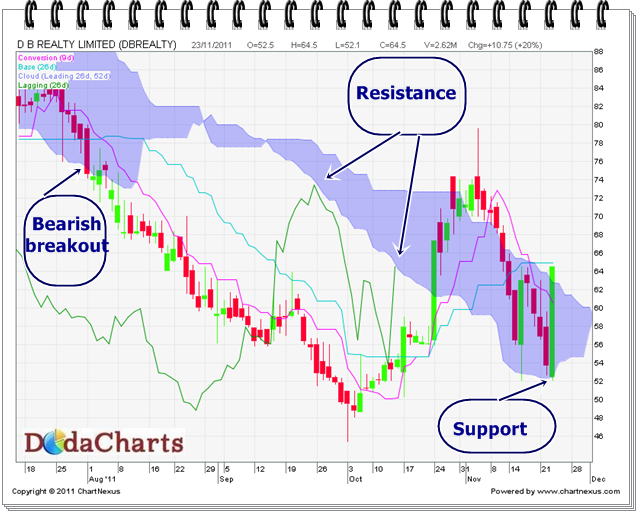
On 01-Aug-2011, it CLOSED down below kumo @74.65 ; thus giving STRONG bearish breakdown. That was good opportunity to exit from this stock and do short selling. Then, from 03-Oct-2011, after touching the lows of 45.40, it started moving upward, but faced STRONG resistance on kumo . It started its downward journey again and found support again on kumo . Yesterday , it moved 20% up @64.50 . But Chikou-Span (CS) is still BELOW kumo . So, one should NOT take any long position here till both – Chikou Span (CS) and price CLOSED above kumo . It’s better to avoid this stock till then.
Resistance: 67.50
Support: 45.40