Rise and Fall of Parsvnath Developer Ltd. | Technical Chart | 24-Nov-2011
Below is the technical chart of Parsvnath Developer Ltd., listed on Indian Stock Exchnage , with ichimoku Indicator.
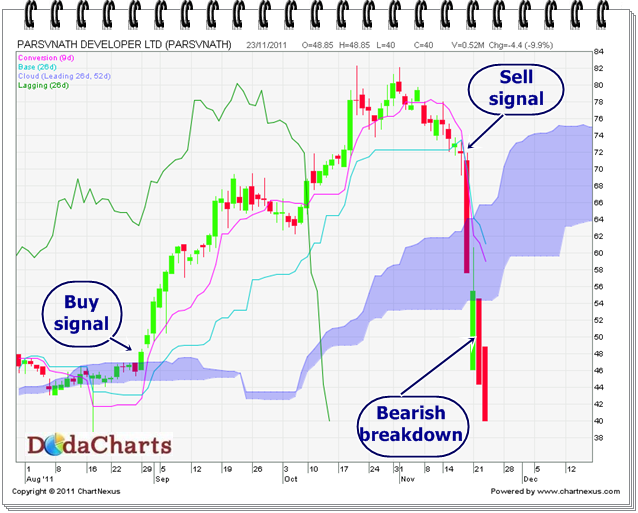
With Ichimoku indicator, the reading of chart becomes so easy, that one can easily take buy, profit booking / sell signal, short selling signal – almost all signals.
On 29-Aug-2011, the stock price CLOSES above kumo at Rs.48.20 , thus giving bullish breakup and buy signal. From there, it started its upward journey and touched the high of around Rs.82 .
Then on 17-Nov-2011, it closed below kijun-sen line, thus giving signal to book your profits and exit from stock at 71.95.
And finally on 22-Nov-2011, it closed below kumo @44.40 , thus giving bearish breakdown signal and opportunity to do short selling in this stock. Avoid this stock now as it will surely move more down from here.