RSI Introduction
The Relative Strength Index ( RSI ) is an indicator of technical analysis that determines the strength of the current trend in the market, as well as the likelihood of its change. In other words, RSI anticipates the probability of a trend change and the stage of its development, measures the relative strength of the market, tracking closing prices.
The author of this technical indicator is W. Wilder. According to his recommendations, the most optimal period for the oscillator is RSI = 14.
The RSI value can range from 0 to 100.
RSI Formula
The RSI formula is as follows:
RSI = 100 – [100/1 + RS],
where RS is the average value of positive closing price changes for a certain number of days divided by the average value of negative changes in the closing price for the same number of days.
For example, to calculate the 9-day indicator of RSI, you first need to sum all the price increments (in points) on growth days over a 9-day period and divide the sum by nine. Then sum all the negative price changes noted on the decline days for the 9-day period, and divide the amount by nine. After that, find the relative strength (RS) by dividing the average positive price change by the negative average. Finally, substitute the value of RS in the formula RSI and get an oscillator with an amplitude of oscillations from zero to 100.
You can build this indicator for any number of periods that the trader likes. Wilder initially offered 14 days, but today many traders prefer a faster and more sensitive robot, such as a 5, 7 or 9-day RSI indicator. Overbought and oversold levels are usually set at 70 and 30 or 80 and 20. Some traders try to optimize the number of days in the RSI calculation for each market individually or change the levels of overbought and oversold levels, adjusting them to the current trend of each market. It is recommended to maintain a permanent 9-day RSI indicator with overbought and oversold levels of 70 and 30 for all markets.
RSI Description
The Relative Strength Index (RSI) is an oscillator. It was introduced by J. Welles Wilder Jr. in his book “New concepts of technical systems of exchange trade”, published in 1978. The popularity of RSI was due to its simplicity and clarity in the interpretation of signals.
The indicator oscillates between 0 and 100: when it reaches the maximum and moves down, it points to the top, when the RSI chart stops falling and moves up – it points to the bottom.
When the average value of positive closing price changes is greater than the average value of negative changes in the closing price of the RSI, the value of RS is increasing, since the value of RS is greater than one, respectively, when the average value of positive changes in the closing price is less than the average value of negative changes in the closing price of the RSI falls, since RS is less than unity.
As with most oscillators, the more data is used to calculate RSI (the longer the RSI period), the more accurate the results will be. In most cases, for the RSI market analysis, a typical overbought and oversold zone method is used. The author (Wilder) recommends using for zones overbought and oversold zones correspondingly above 70 and below 30.
The zone above 70 thus by the author shows that the market is overbought (ie further upward movement will soon exhaust itself), and the zone below 30 is considered oversold zone(ie further downward movement will soon exhaust itself).
However, there are many other variations regarding the ratio of these levels: 75/25 or 80/20. In the Forex market, the last level ratio is often used. As the central, usually consider the level of 50.
The Relative Strength Index is mainly used in markets that are in a sideways trend, because in markets that are in a directed trend, it can be used only to determine entry and exit points within a trend, i. For forecasting local maxima and minima. The use of the Relative Strength Index as the main indicator in the trend market can lead to a large number of false signals.
How to read RSI indicator levels?
- RSI above level 50 indicates an uptrend, and below 50 – about a downtrend.
- If the RSI indicator crossed the level of 50, then the market is overbought, and if the level is down 30, then oversold.
- If the RSI indicator is fixed above the level of 70, then the market has a strong uptrend, and if below the level of 30 – on the contrary, a strong downward trend.
- The beginning of the downtrend is the intersection of the RSI indicator down to level 70, and the beginning of the uptrend is the intersection of level 30 up.
- If the line of the indicator RSI is interrupted, then this is a signal for an early change of trend.
- If the RSI chart does not coincide with the price chart (divergence), then the trend may change soon.
RSI Example
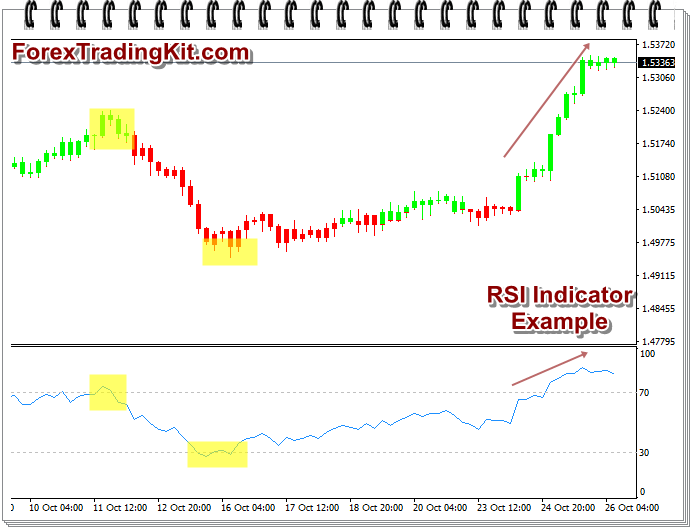
Above chart is on EURAUD currency pair with RSI indicator plotted. It’s clearly visible that that price started to come down when RSI started coming down from level 70 and price started moving upward when RSI started moving upwards from level 30.
Different uses of RSI Technical Indicator
- As an advanced indicator without signals. Maxima behind level 70 and lows below 30 often outstrip the highs and lows on the price chart.
- Trend strategy: some traders perceive the intersection as an indicator on the trend market of point 50 upwards as an uptrend, and fall below 50 as a downtrend. Therefore, crossing level 50, when the market is a trend, in itself is a signal for entering the market. However, in the formation of an undirected lateral trend, such a strategy will give a lot of false signals, since RSI will often cross level 50.
- Countertrend strategy. Signal levels used are 70 and 30, 75 and 25, 80 and 20, or others. At the same time, the signal for sale is given when the RSI leaves the overbought zone. crosses the level of 70% down, and the buy signal is sent when the RSI is out of the oversold zone, i.e. crosses level 30 from the bottom up. However, this strategy works only in the non-trendy period of the market. In the trend period, the indicator will go into one of the zones (with an uptrend in overbought, with a descending oversold) and will feed in this zone a lot of false signals constantly crossing the line separating the zone.
- In Lebo’s book, Lucas “Computer analysis of futures markets” describes a way to deal with false RSI signals, which often occur in overbought and oversold zones. A sell signal appears if RSI forms a double vertex (a figure of the type // – the letter M) in the overbought zone (for example, over 70), with the second vertex lower than the first. The sell signal appears when the bottom of the double top is broken. Conversely, if the RSI creates in the oversold zone (for example below 30) a double base figure (figure of type // or W), where the second minimum is higher than the first, then the buy signal is given if RSI breaks the level of the average high up. It is believed that the higher in the overbought zone and the lower the oversold zone, the stronger the signal.
- Signal divergence. As with other oscillators, the divergence signal comes in the case of a discrepancy between the ratio of new highs or lows on the oscillator chart and the price. If on the oscillator chart the new maximum is lower than the previous one, and on the price chart the new maximum is higher than the previous one, there is a “discrepancy” between the oscillator and the price. This is a signal to sell. If the price makes a new low below the previous one, but an oscillator makes a new low above the previous one, this means that the relative strength of the downward trend decline is nearing, the turn is coming up and the signal for purchase comes. It is assumed that the distance between the minima and maxima on the oscillator should be from 7 to 50 periods, otherwise t,he divergence will be too “raw” (if less than 7) or already “burnt out” (if more than 50).
- Graphic patterns. On the RSI chart, there often appear graphic patterns that traders use in analyzing price charts (such as head-shoulders, triangles, etc.).
- Support and resistance levels on the relative strength index graph often show more explicit levels of support and resistance than on the price chart itself.
Disadvantages of RSI Technical Indiacator
It works poorly during the trend on the market (it gives many false signals).
Overbought and oversold
According to the creator of this indicator, when the price moves very fast and the indicator flies upwards, it means that the price is in the overbought zone and will soon be exhausted. And there, that and look, will start to fall.
The converse is also true. If the RSI has flown down, we see a situation of oversold and it is necessary to wait patiently for a trend reversal. Wherein:
- RSI over 70 = overbought;
- RSI less than 30 = oversold.
For example. RSI more than 70, overbought and reversal of the price.
When level is between 70 and 30 – it’s a neutral situation, and about 50 – in general, the lack of a trend.
Divergence in RSI
Any oscillator has an unequivocally working tool – it’s a divergence. It is good everywhere, with stochastic, MACD and many other oscillators.
At RSI we see exactly the same picture. In divergence, the fact is that the indicator is at variance with the price, which indicates its turn.
- Bullish divergence – the price down, RSI up.
- Bearish divergence – the price is up, RSI is down.
Internal turn
But here we do not look at the price at all, we are not interested. All attention to the RSI itself. Internal (inbound) spread consists of 4 following steps:
Bull reversal (on price increase)
- RSI falls below 30 (oversold).
- It jumps above 30.
- Bounces back, but still above 30.
- Breakthrough – a change of trend took place.
Bearish turn (to the price drop)
- RSI rises above 70 (overbought).
- It falls below 70.
- Rises again, but still below 70.
- Breakthrough – change of trend.
How to trade with the RSI indicator
Quite often, the indicator Relative Strength Index is called an indicator of oversold or overbought, although this is not always correct. The point is that the moment when the indicator reaches these zones is not a signal to buy or sell. This indicator is used mainly to determine the entry / exit points to the market.
In other words, when the level 70 crosses the market, the market is considered to be overbought, and if it falls below the level 30, it is oversold. In this case, the moment of crossing these levels is not a signal to immediate sale or purchase, since the indicator Relative Strength Index can be in this zone for a long time. In general, the position of the indicator above level 70 with a strong uptrend indicates the beginning of a large increase or below the level of 30 with a strong downtrend – a fall.
The moment of entering the market, i.?. reversal of the trend is the situation when the indicator RSI leaves the overbought or oversold zone. For example, when RSI is above level 70, a trader prepares to sell, but does not open a deal. Opening of the position occurs at the moment when the RSI crosses the level of 70 down. The opposite strategy should be used for level 30, i.e. the purchase transaction is opened only when the level indicator 30 crosses from the bottom to the top.
In addition, level 50 is used for the analysis, which divides the market into a zone of sellers and a zone of buyers. This level in the indicator RSI is used by traders to confirm the validity of previously opened transactions for purchase or sale.
It is important to know!
This indicator should never be used as the only tool for deciding whether to enter the market. He, like any indicator, often gives conflicting signals. Long stay in overbought and oversold zones, strong price fluctuations on the basis of any fundamental indicators – all this makes adjustments to the effective indications of the indicator. Therefore, in real trading, this indicator should be used in addition to any other tools, for example, in conjunction with trend indicators, Price Action patterns, levels, etc. You can use other technical indicators like Stochastic, MACD, Doda Donchian, Ichimoku etc.
Main conclusions
- The Relative Strength Index indicator refers to oscillators;
- This indicator has only one customizable period: the length of the time interval used in the calculation;
- RSI is never late, it refers to advanced indicators;
- Divergence is the strongest RSI signal;
- The classical technical analysis is applicable to the graph of the RSI indicator;
- On one indicator RSI – the trading system cannot be built!
I suggest you to use Doda Donchian and Ichimoku technical indicators along with Relative Strength Index indicator.