SBI Technical chart | 31-Oct-2011
Here is a technical chart of State Bank of India, list on Indian stock market. I’ve used the famous Ichimoku indicator to expalin the chart.
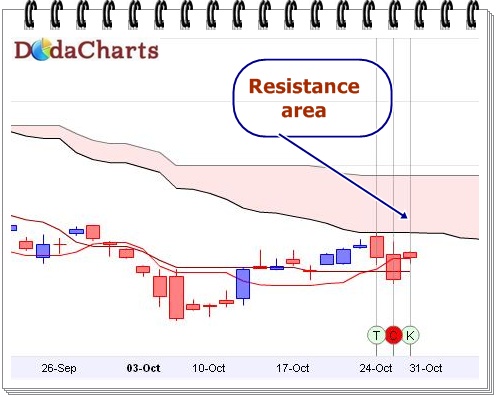
As clearly visible in the chart, the price is trading below kumo. The range between Rs.2000-Rs.2200 is the no-trade zone. That means the price may give bullish breakout after Rs.2000 level or bearish breakout below Rs.2000 level. So, it is advised to ignore this stock at this moment and sit on cash. Wait till it CLOSES above Rs.2200 to buy it.