Sell GBPUSD | Technical chart | 09-May-2012
Below is the technical chart of GBPUSD, using ichimoku kinko hyo indicator, Doda-Donchian and Doda-Bollinger Bands, on H4 time frame.
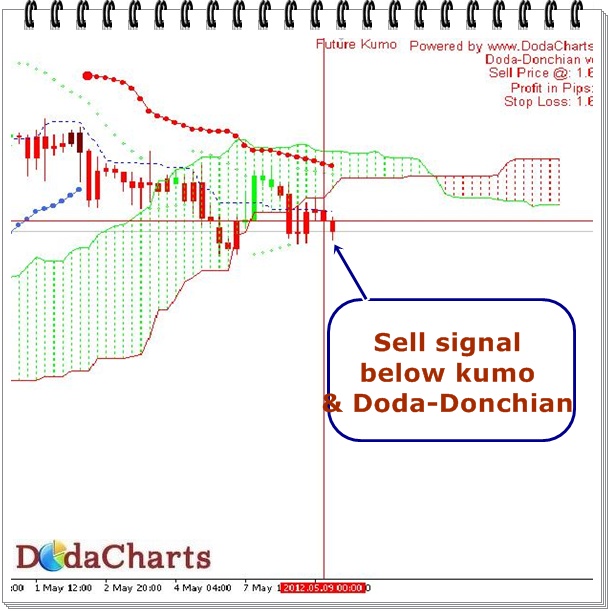
GBPUSD price has already closed below kumo and Doda-Donahian line; thus giving bearish kumo breakout signal. On the upside, resistance will be at 1.6147 and 1.6156 and one the downside, support is at 1.6113.