Sensex Technical chart | 09-Nov-2011
Here is a technical chart of BSE-30 with Ichimoku Kinko Hyo indicator.
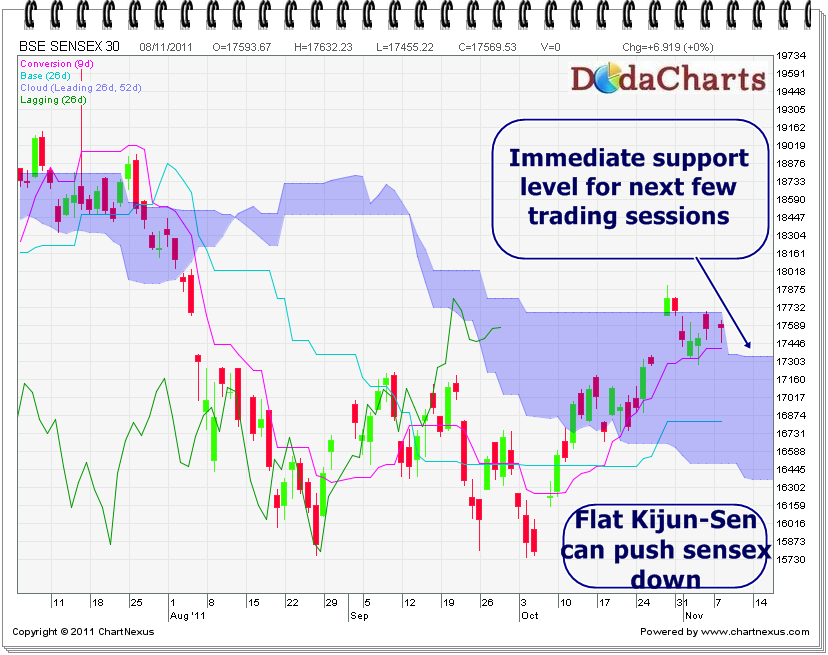
BSE Sensex has closed down to the level of 17,569 in the last trading session. The price is trading near kumo. It made many attempts to CROSS kumo, but it failed. So, kumo is acting as STRONG resistance here viz. @17,700.
Looking at chart, Sensex will get support at 17,351 in the next few trading sessions.
One thing on which I’m not feeling comfortable is flat kijun-sen line. It can PUSH sensex down to the level of 16,826, if this line does to rise from here. Be cautious till then.