Sensex Technical Chart | 20-Oct-2011
Below is the technical chart of Indian stock market indice Sensex (BSE) using Ichimoku Kinko Hyo indicator.
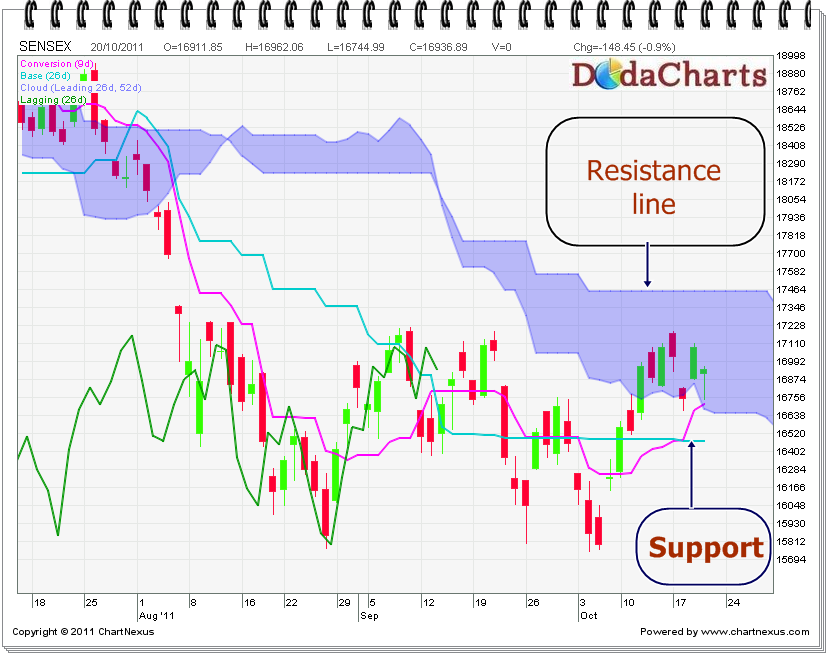
Sensex has been moving in the range of about 16500-17200 from the last few trading sessions. It’s not going anywhere. If you see the chart carefully, you’ll aboserve that price is trading INSIDE kumo (the blue area of chart); which is a no-trade zone. One should avoid any call when price is inside kumo.
Now, 2 important points here.
1) The kijun-sen line is flat here. That means, it will attract price here. So, in next few trading sessions, Sensex may kiss the level of 16468. 2) On the upside, 17457. It should CLOSE above this level to show next bull run. Till then, sit on cash and wait for the right time for investments.
For those, who are new to Ichimoku indicator, you can see the tutorials and examples of same at DodaCharts Tutorials