Sesa Goa Ltd. Technical chart | 22-Dec-2011
 Let us discuss the technical chart of Sesa Goa, listed on Indian stock exchange, with Ichimoku Kinko Hyo indicator.
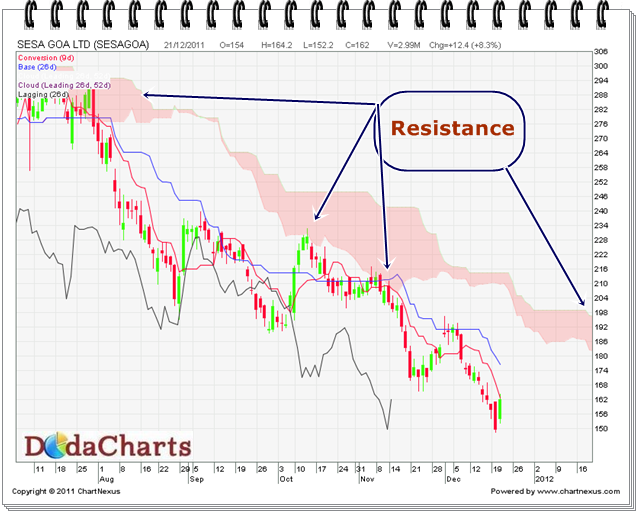
The stock price of Sesa Goa is in clear downtrend as visible in the above chart. The interesting point here is that it tried to cross kumo several times and it failed. Kumo always acts as strong resistance for any stock. Right now also, it is trading below kumo. So, I suggest NOT to buy it at current levels. Wait for it to close above kumo i.e. above 197.