Shaw Group Technical chart | NYSE | 22-Dec-2011
 Here is a technical chart of Shaw Group, stock listed on NYSE, with Ichimoku kinko hyo indicator.
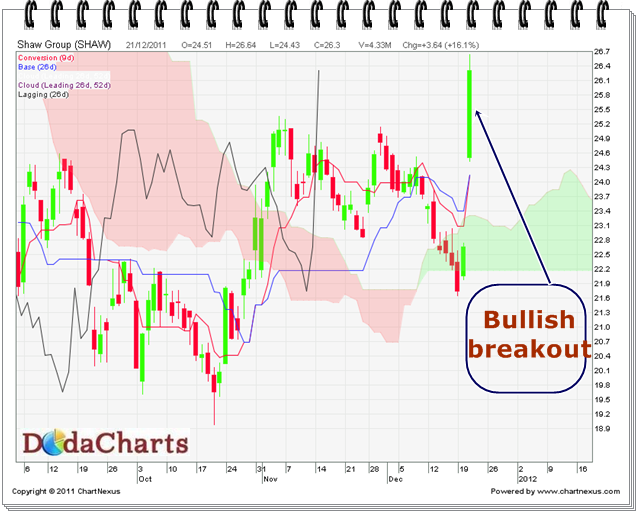
The stock closed above kumo in the last trading session giving bullish breakout. One can still buy this stock as it will run more from here. 25.82 is the immediate support level and below that is 23.02. Resistance will be at 34.14 – 34.75