Siemens Ltd. Technical chart | 07-Dec-2011
Siemens technical chart, listed on Indian stock exchange, with ichimoku Kinko Hyo indicator, has been explained below.
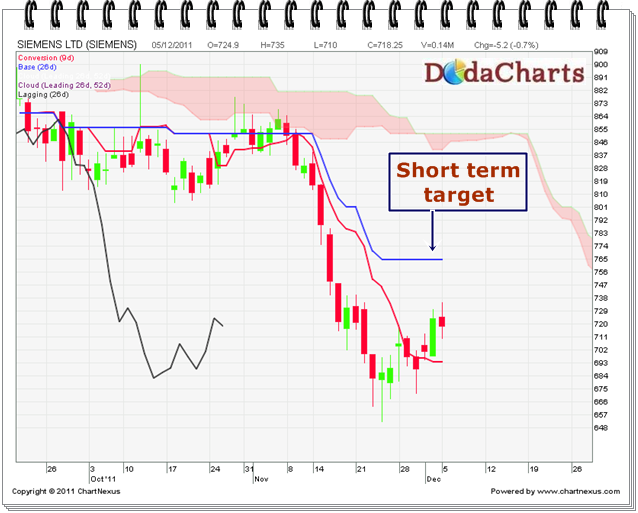
The price is trading below kumo, so it is in bearish mode. One should not buy this stock for investment. However, kijun-sen line is flat. So in the short term, the price can touch 763.90. The next level is 800. Closing above 826 will start its bull run.