Silver Technical Chart | 18-Dec-2012
Below is the technical chart of Silver using Ichimoku and some other useful indicators.
I’ve taken one day time frame to get bigger picture of technical analysis.
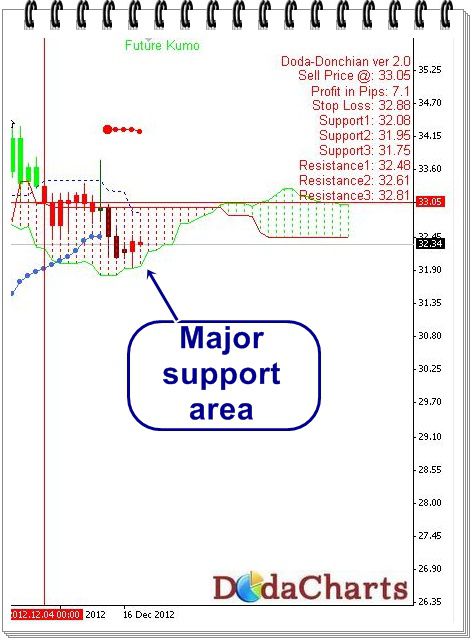
Silver is in downtrend from the last many trading sessions. The main level to watch for this week is $32.66. It needs to close above this level to enter bull zone. Below this level, it’s weak.
On daily chart, it manages to get support at the bottom of kumo (see chart above). So, Kumo is acting as strong support for silver.
But let it close above $32.66 to take long position.