State Bank of India (SBI) Technical Chart | 13-Mar-2012
Below is the technical chart of State Bank of India (SBI), listed on Indian stock exchange, using Ichimoku Kinko Hyo indicator. For better results, I’ve used weekly time frame.
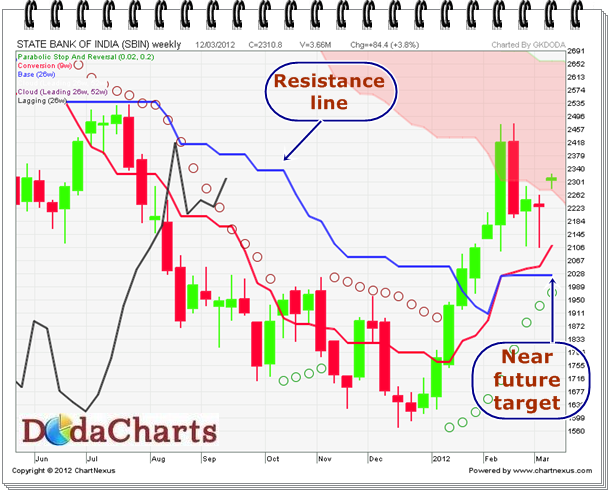
The price is trading inside kumo, which is no trade zone. On the upper side, chikou-span line will face resistance at kijun-sen line @2335.7. But the main point here is flat kijun-sen line @2023.70. Not only on this chart, but many charts on Sensex are showing the same flat lines. Now, does that mean that market is planning for 10% correction? Who knows the answer? But time is good to book profits.
If you’re a mutual fund investor, continue with your SIP.