State Bank of India (SBI) Technical Chart | 17-Jan-2012
Below is the technical chart of State Bank of India (SBI), listed on Indian stock exchange, using Ichimoku Kinko Hyo indicator.
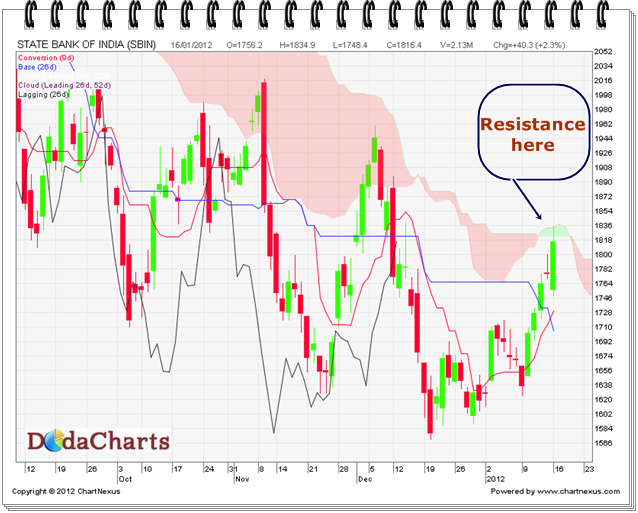
In the last trading session, SBI touched the upper end of kumo viz. @1837. One can buy SBI stock once it closes above 1837. Make a stop loss of 1821. After that, after few trading sessions, it can touch 1794. Add your positions more on that level.