State Bank of India technical chart | 11-Nov-2011
 Here is a technical chart of State Bank of India (SBI) listed on Indian stock exchange. I’ve used Ichimoku Kinko Hyo indicator.
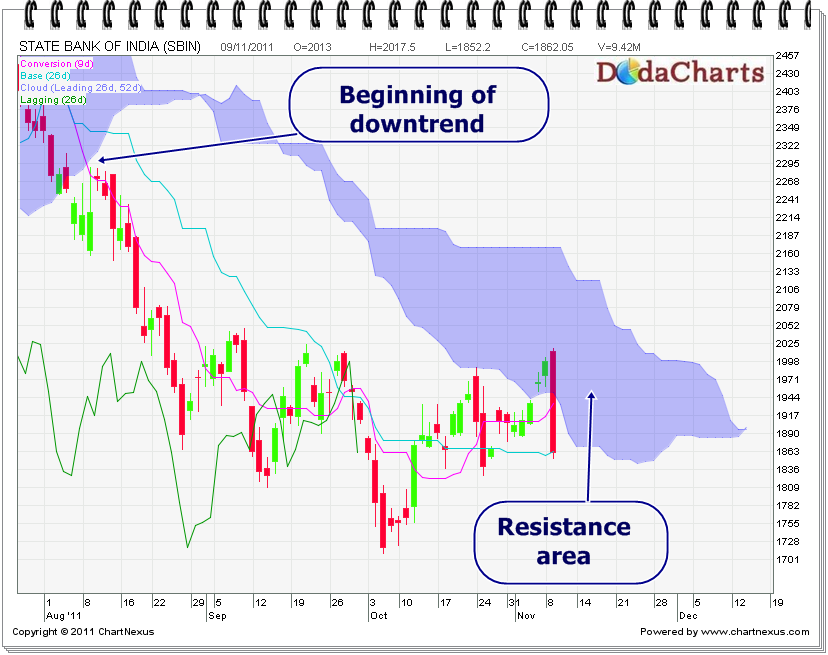
On 4-Aug-2011, SBI price CLOSED below kumo and that was the fisrt signal of its weakness. From there it started its downward journey – from 2257 to current 1862. Even now, it is trading below kumo and one has to wait for its closing above kumo for uptrend. It will start its uptrend if it CLOSES above 2170. Till then, avoid this stock.