State Bank of Mysore Technical chart | 04-Dec-2011
 Below is the quick comments on technical chart of State Bank of Mysore, listed on Indian stock market, with Ichimoku Kinko Hyo indicator.
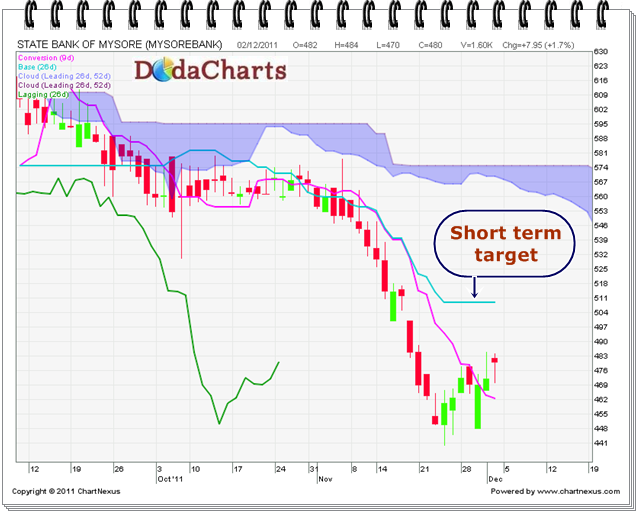
The chart clearly indicates a short term trading opportunity as the price was moving downward but Kijun-sen line was flat. As a result, the price is moving upward to "kiss" kijun-sen line.
So, one can buy the stock at current levels for the target of 508.80 in coming days. Make a stop loss of 447.60.