Stochastic Indicator - Tutorial, Secrets
Technical analysis has a whole section dedicated to indicator trading. Throughout the history of exchange trading, hundreds of indicators have accumulated in the arsenals of traders and investors, many of which have become the basis of a variety of trading strategies. But the truly worthwhile and popular among them are no more than a dozen. One such technical indicator is the Stochastic Oscillator.
It refers to oscillators - indicators that give the best signals while the asset is in the price corridor (in consolidation). In simple terms, Stochastic shows the probability of a price reversal at certain levels. It should be used in combination with one of the trend indicators, as it works great when prices move sideways, but can give false signals if the price is trending.
How Stochastic works
Stochastic parameters, such as the averaging period and smoothing, are entered into the settings by the user or remain the same as those that were set by default. According to them, the indicator behavior is calculated automatically and displayed in a window separate from the price chart. Stochastic consists of two lines - fast and slow (%K and %D). They are calculated according to the following formula:
%K = (close price - min. price) / (max. price - min. price);
%D = %K averaged over three periods.
In the classic version, %K is drawn on the chart as a solid line, and %D as a dotted line. They walk one after another in a limited corridor, the range of which is on a scale from 0 to 100. Usually, two levels are indicated in the settings: lower (20) and upper (80). If the Stochastic lines go beyond the lower level, then the asset is oversold, if it goes beyond the upper level, it is overbought.
If the indicator goes beyond the indicated boundaries, it means that the price shows a record minimum or maximum value for the period selected in the settings. If this happens in a flat, there is a high probability for a price reversal. In the case when the Stochastic goes into overbought/oversold (b/p) zones during a trend, the signals of trend indicators (for example, Bollinger Bands) are preferred.
Breakdown of borders and behavior of the Stochastic indicator in critical zones
It implies the intersection of the basic levels by the main line of the Stochastic on a strong trend , that is:
- On an uptrend: a breakdown of the overbought level of 70(80) is the first signal of a slowdown in growth and a possible downward reversal.
- On a bearish trend: a breakdown of the oversold line 30(20) on a downtrend is a signal for fixing sales and a possible upward reversal.
After crossing the lines above/below the basic Stochastic levels, we also consider two options:
- An upward reversal in the oversold zone (20/30) is regarded as a scheme for buying, if there is a crossover (from bottom to top) and exit from the zone of the slow %D line, the signal is getting stronger.
- A reversal from the overbought zone (80/70) is interpreted as a situation for selling, if further the lines break through the level from top to bottom, the signal is more reliable.
It is also recommended to pay attention to the shape of the “in the zone” reversal: if the lines form a “sharp” max/min (“narrow reversal”), then the subsequent movement should be strong and sharp, if the level is broken after a flat in the critical zone (“wide reversal” ). ”) – weaker, but stable.
Trading strategies with the stochastic indicator
Overbought and oversold areas marked by the Stochastic
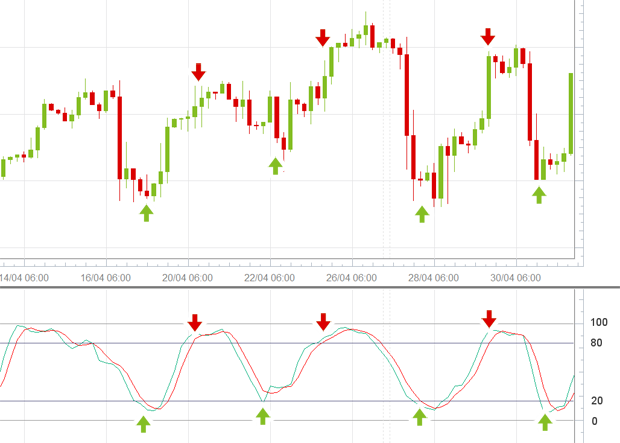
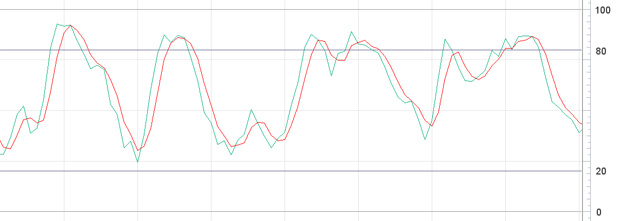
As with all oscillators, it is interesting in range areas to go long when oversold and short when overbought. As this example illustrates quite well, as soon as the stochastic marks a local extremum, prices tend to retrace the previous movement.
Let us underline it once again, this is only valid in the range zone or else in the direction of the trend, but it would be inept to short the oversold in a bullish background trend.
%K %D crossings
Now let's see what this %D can be used for. In reality, it is just a moving average (usually set to 3 periods) serving as a signal curve. Its usefulness is to be able to use the stochastic as a trend following indicator. Since overbought and oversold areas are of little interest in the trend, we filtered the %K in order to reveal precise entry points in the trend. These points are determined by crossing the %K and the %D. As soon as the %K crosses the %D on the rise, then there is a buy signal and vice versa for a sell signal.
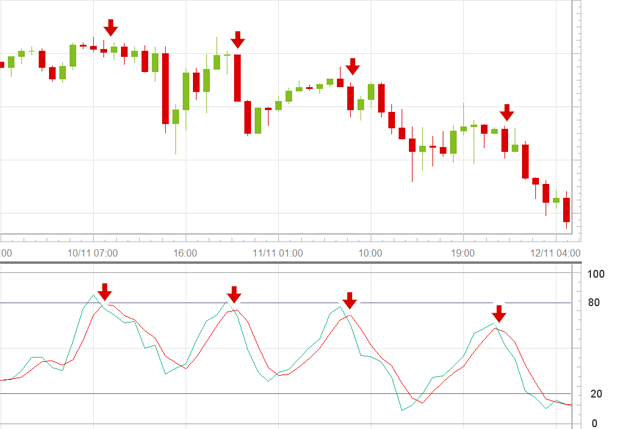
Here on this example we identify a clear downward trend on the courses, therefore we will favor the taking of selling positions. In this case when the %K crosses its signal curve downwards we would interpret it as a sell signal.
Divergence of Stochastic indicator lines with a price chart
A rather rare, strong leading reversal signal, but you need to know how to use it.
- The fall of the %K-%D lines on an uptrend means a high probability of a downward reversal, which means we open SELL. If the Stochastic is above the oversold border level, Stop Loss is below the last price min.
- The indicator showed a new max on a downtrend - a reversal upwards is likely, then we buy. If the Stochastic is in the overbought zone at the moment of divergence formation, Stop Loss is behind the local max.
Breakout of the center line
The balance line divides the area of the Stochastic indicator into the area of buyers (50-100) and the area of sellers (0-50), so movement near the level of 50 means uncertainty in the market, that is, the price is approximately in the middle of the range. The breakdown of the line from the bottom up and further growth - the bulls are getting stronger - buying is a priority. Breakdown from top to bottom and further fall - the bears are stronger, then we are getting ready to sell.