Stochastic Oscillator
Stochastic Oscillator is a momentum indicator which fluctuates between 0 and 100. It shows the location of the last closing price compared to the lowest / highest price range over a given period of time.
The indicator shows how the current price compares to the highest and lowest price over the look back period. Typically the look back is 14 periods; on a weekly chart that is 14 weeks, on an hourly chart 14 hours.
Stochastic Formula
The indicator has two lines called %K and %D; which are calculated as follows:
%K = (Current Close – Lowest Low) / (Highest High – Lowest Low) x 100
%D = 3-day SMA of %K
Where:
Lowest Low = lowest low for the look-back period (typically 14 periods)
Highest High = highest high for the look-back period (typically 14 periods)
SMA = Simple Moving Average
The above formula is for a “Fast Stochastic,” but there is also a “Slow Stochastic” version. It is the same as above except the Slow %K is averaged over 3 periods.
Slow %K = 3-period SMA of Fast %K
Slow %D = 3-period SMA of Slow %K
Since the Slow Stochastic is less choppy, many traders prefer it over the other one.
How to read Stochastic Indicator?
Stochastics is plotted with a positive scale that ranges from 0 to +100. There are 3 major rules to learn.
- Stochastic value above 80 is said to be overbought (possibly there will be a trend change to bearish). Value above 20 is said to be oversold (possibly there will be trend change to bullish). Keep in mind that these signals are sometimes not 100% correct. A currency price is overbought, and Stochastic value is above 80, possibly still able to rise again. Vice versa.
- 50 is an important mid-point: If the indicator is overbought (above 80) and then falls below 50, it indicates the price is moving lower. If the price was oversold (below 20) and rallies above 50 it indicates the price is moving higher.
- Buy and sell signals can also be seen and line% K and% D. If% K cuts% D upwards, it means a buy signal. Whereas% K cut% D down means sell signal.
Example of Stochastic Indicator
Below is the daily chart of EURCHF currency pair on Stochastic indicator. Time frame used is Daily.
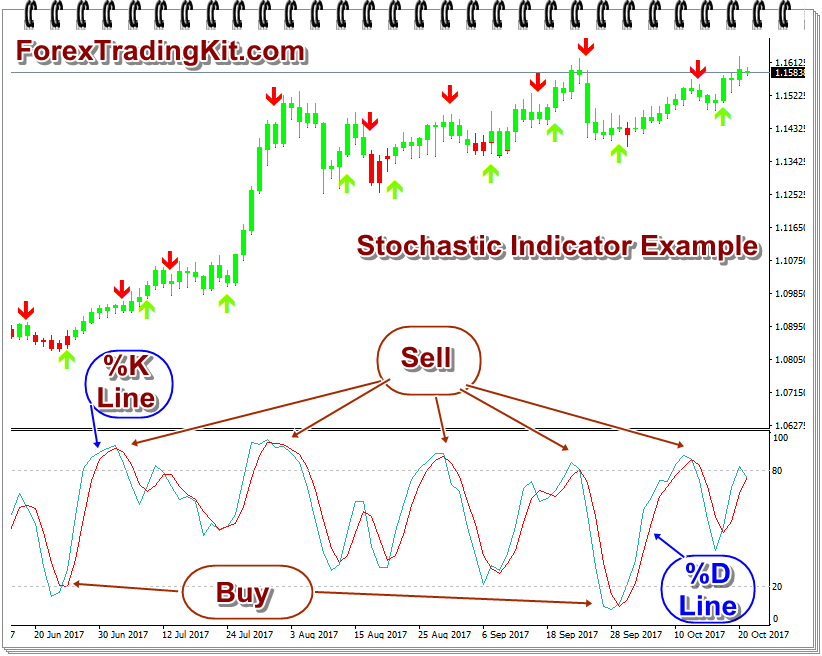
One can easily see how buy and sell signals are generated by Stochastic indicator. When %k line crosses %d line upwards below 20, the price has moved upward.
Limitation of Stochastic Indicator
Like any other oscillator, this indicator also gives many false signals. Just because Stochastic value is below 20, one should take long position. The price can move further down for some time, making a considerable loss of your money.
Similarly, indicator value can be above 80 for longer period of time and still the price can rise further.
Keep in mind that this is a very sensitive indicator. Because of this nature, this indicator is popular among traders, but not suitable for investors, or traders who have a long time frame.
You can check details of this indicator on Wikipedia too.
Stochastic Indicator in Forex Market
As discussed limitation of this indicator and by practical experiment, I suggest NOT to use this indicator in this way in Forex market. Forex trading is not for shorter time frame like 5 minutes or 15 minutes. It is meant to be for longer time frame like H4. Considering longer time frames, this indicator is not meant for forex trading.
However, one can use this indicator in addition to other indicators like MACD, RSI etc., but not alone. You can also use Doda Donchian for Forex Trading.
Secondly, there is one variant of Stochastic indicator, popularly known as Doda Stochastic, which is very powerful and accurate and can be used in Forex trading. Will write another full article on same soon. So, keep in touch.
Almost all forex platform software provides this indicator with the software and that too free. You can also download MetaTrader forex software to check this indicator.