Support levels of Dow Jones | 23-Mar-2011
 In my previous article, under tutorial section, I’ve discussed how to find support and resistance levels of chart using Ichimoku indicator. Now, I’m posting another example on the same. Below is the daily technical chart of Dow Jones using Ichimoku indicator.
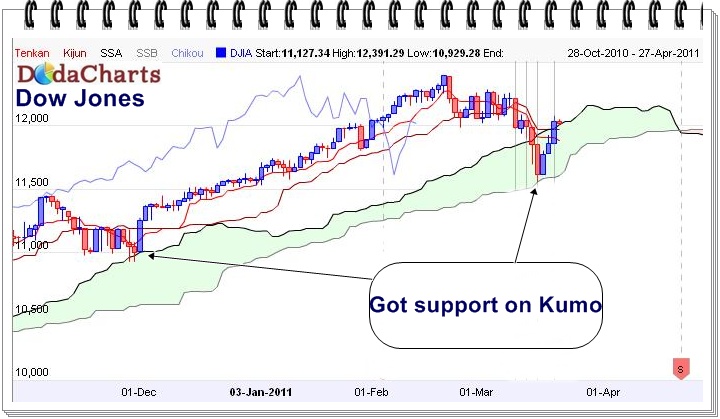
If you see carefully, the price took support on Senkou Span A and Senkou Span B lines of Kumo twice on around end of November 2010 and then on 16-Mar-2011 respectively.
The chart will turn bearish once it closes below kumo.
Now, you must have realized how easy to find support levels of any chart.